Annotates zoom lines for a specified genomic region of a plot
Source:R/annoZoomLines.R
annoZoomLines.RdAnnotates zoom lines for a specified genomic region of a plot
annoZoomLines(
    plot,
    chrom,
    chromstart = NULL,
    chromend = NULL,
    y0,
    x1 = NULL,
    y1,
    extend = 0,
    default.units = "inches",
    linecolor = "grey",
    lty = 2,
    params = NULL,
    ...
)
Arguments
- plot
Input plot to annotate genomic region zoom lines from.
- chrom
Chromosome of region to draw zoom lines from, as a string.
- chromstart
Integer start position on chromosome to draw zoom lines from.
- chromend
Integer end position on chromosome to draw zoom lines from.
- y0
A numeric vector or unit object indicating the starting y-values of the zoom line segments. If two values are given, the first value will correspond to the left zoom line and the second value will correspond to the right zoom line.
- x1
A numeric vector or unit object indicating the stopping x-values of the zoom line segments. If two values are given, the first value will correspond to the left zoom line and the second value will correspond to the right zoom line. If NULL, straight lines from zoomed genomic region will be drawn.
- y1
A numeric vector or unit object indicating the stopping y-values of the zoom line segments. If two values are given, the first value will correspond to the left zoom line and the second value will correspond to the right zoom line.
- extend
A numeric vector or unit object indicating the length to extend straight lines from each end of the zoom line segments. If two values are given, the first value will correspond to the top extension length and the second value will correspond to the bottom extension length. Default value is
extend = 0.- default.units
A string indicating the default units to use if
y0,x1,y1, orextendare only given as numerics or numeric vectors. Default value isdefault.units = "inches".- linecolor
A character value specifying zoom line color. Default value is
linecolor = "grey".- lty
A numeric specifying zoom line type. Default value is
lty = 2.- params
An optional pgParams object containing relevant function parameters.
- ...
Additional grid graphical parameters. See gpar.
Value
Returns a zoom object containing
relevant genomic region, placement, and grob information.
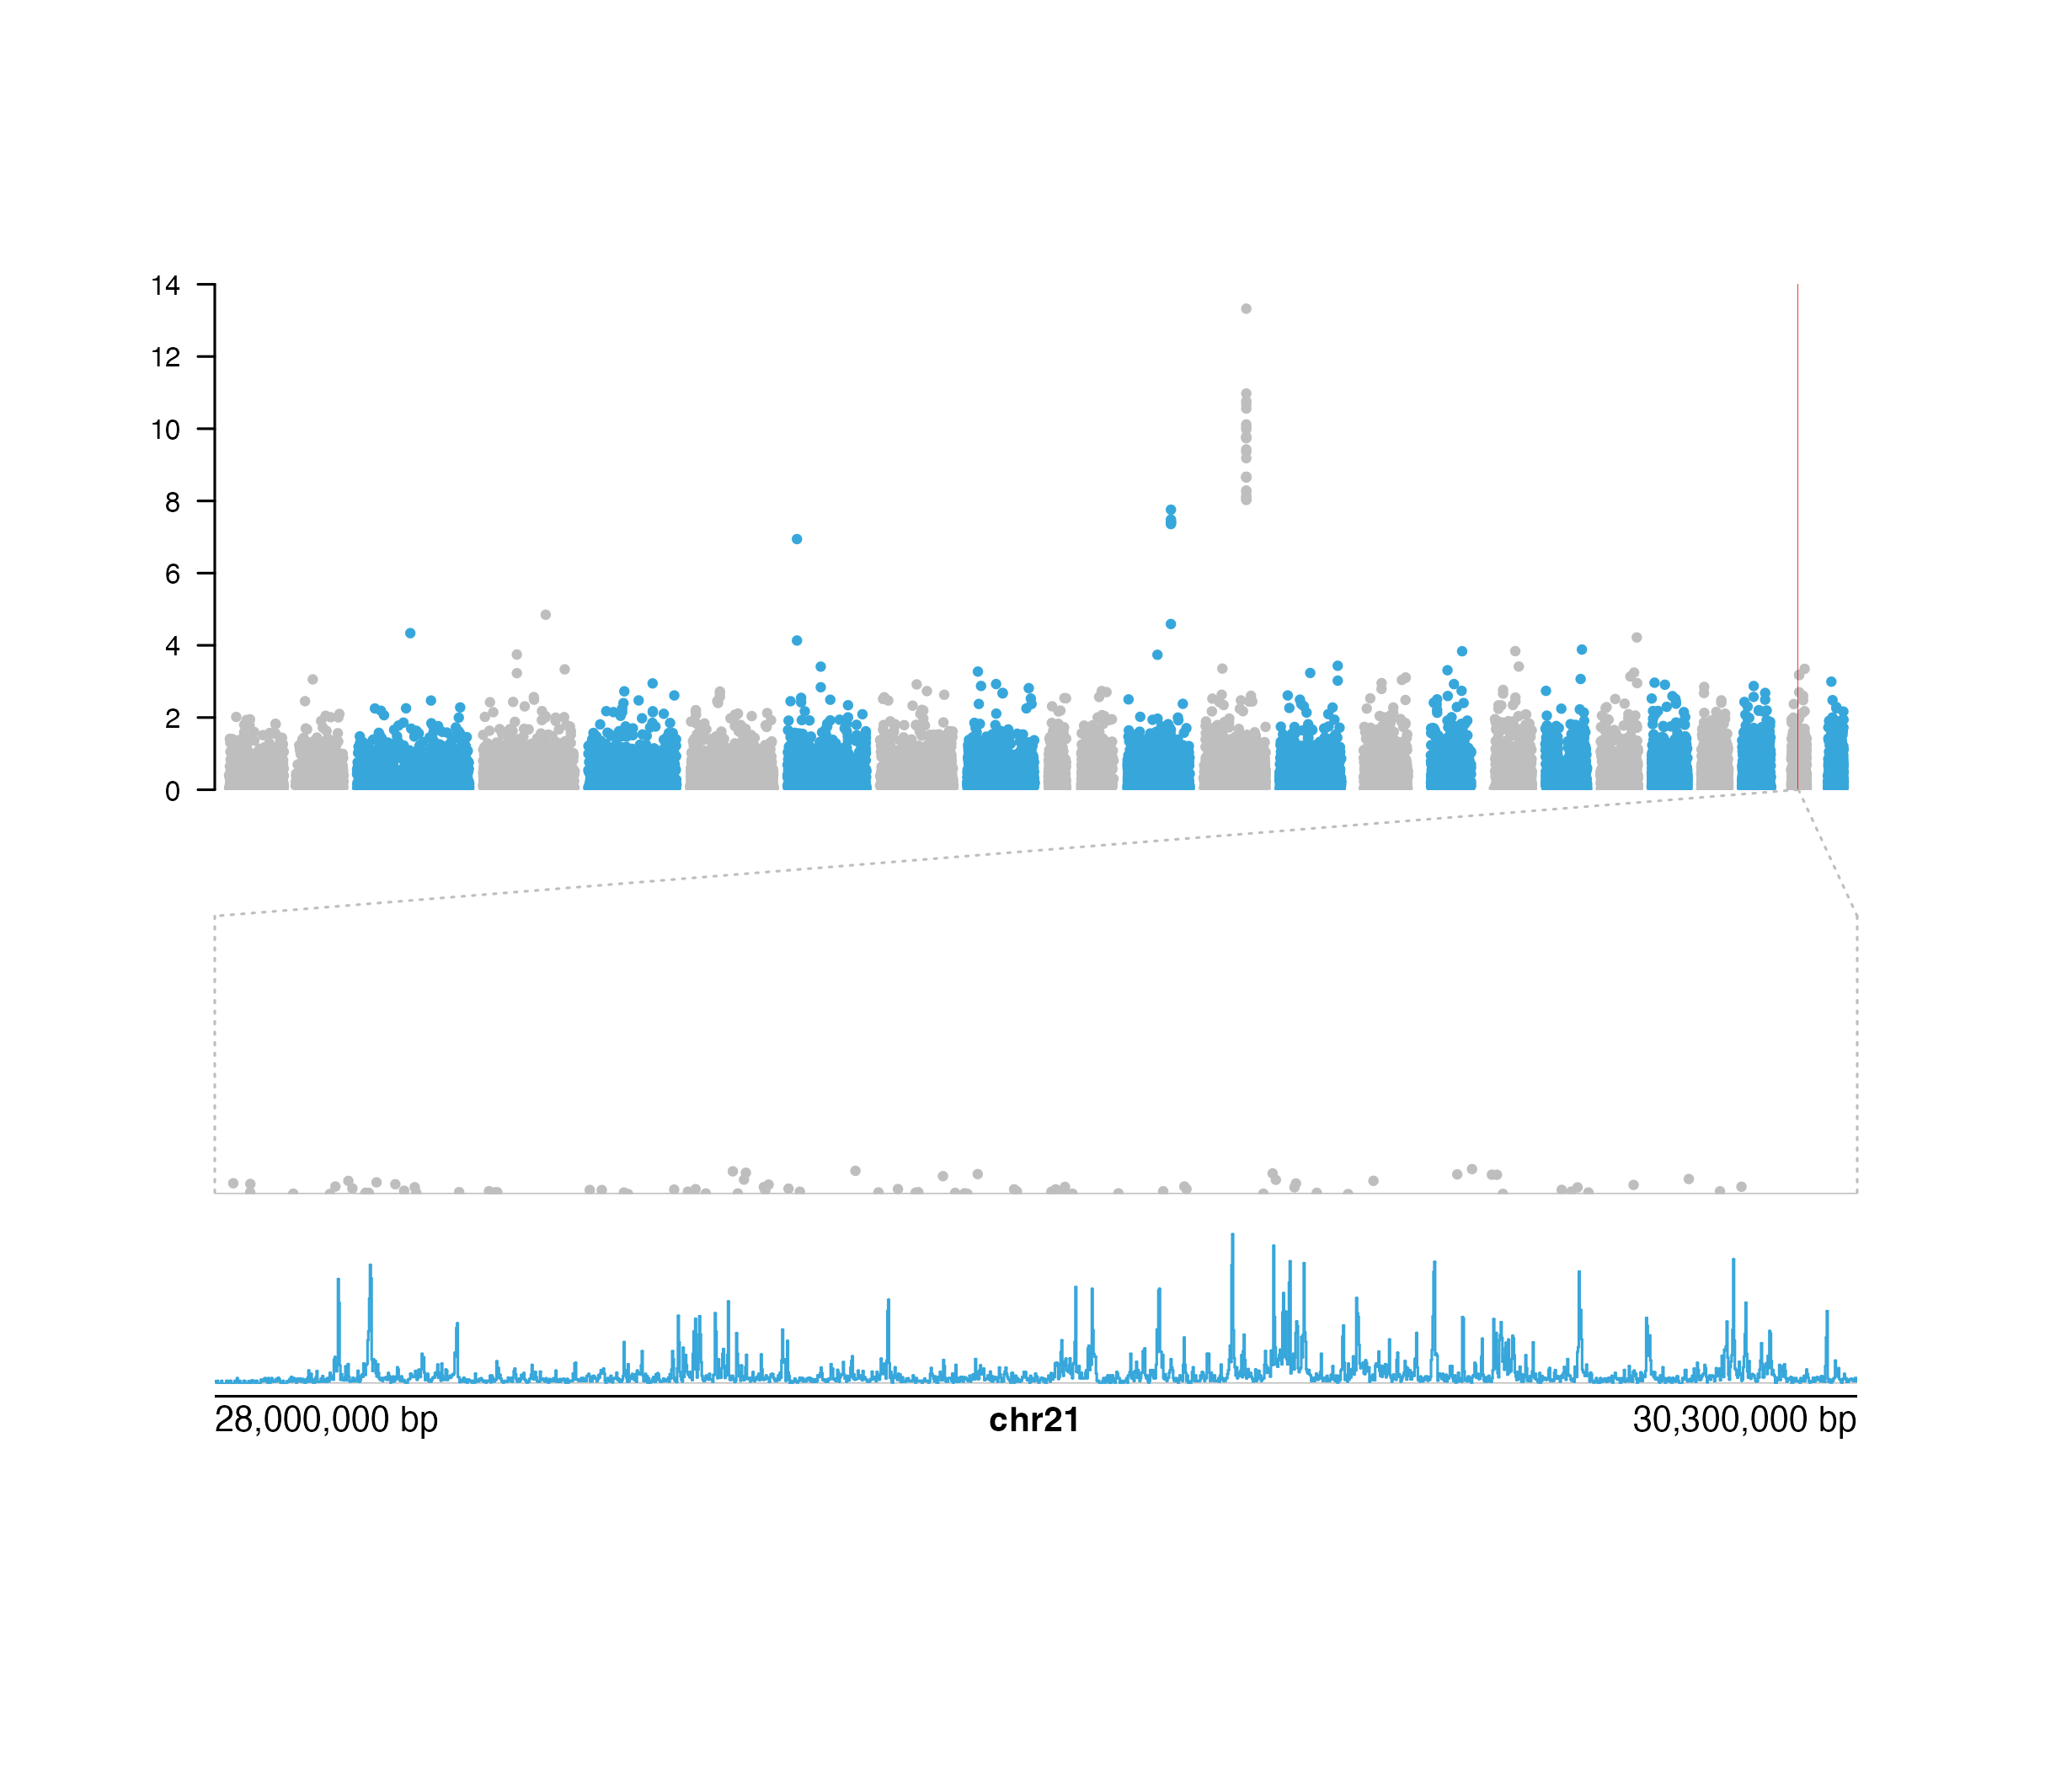
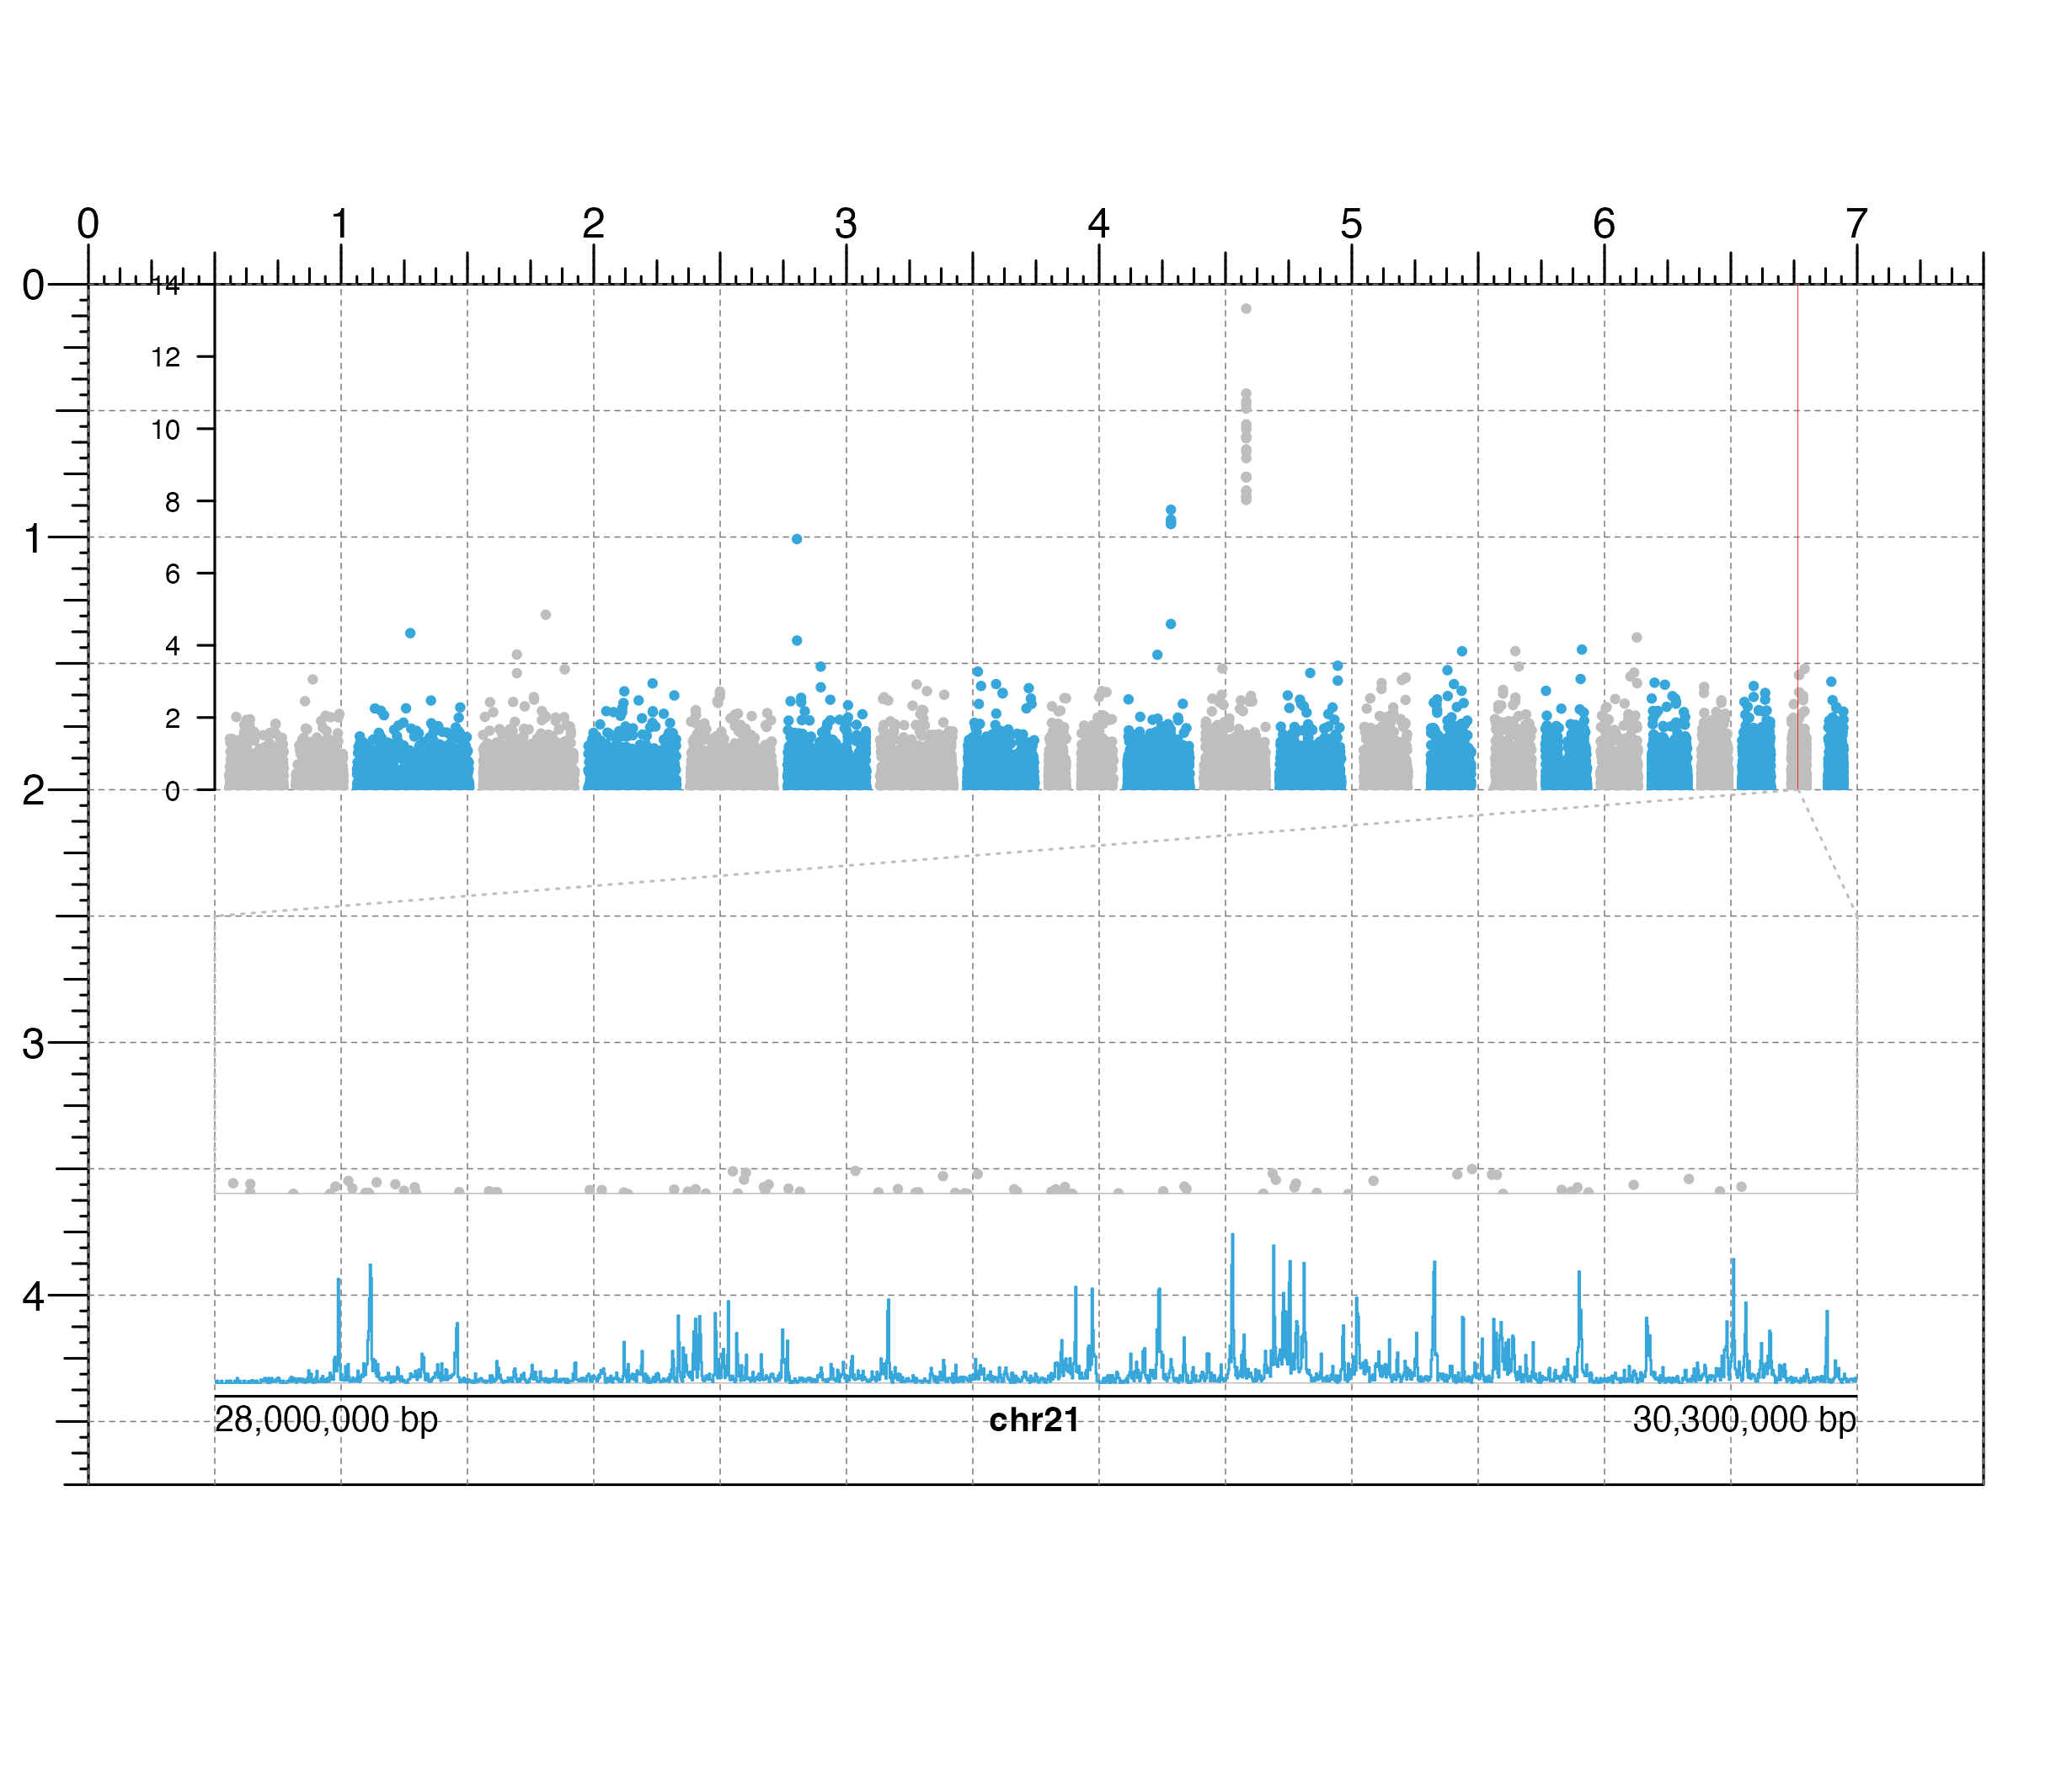
Examples
## Create a page
pageCreate(width = 7.5, height = 4.75, default.units = "inches")

## Plot and place a Manhattan plot
library(plotgardenerData)
library("TxDb.Hsapiens.UCSC.hg19.knownGene")
data("hg19_insulin_GWAS")
manhattanPlot <- plotManhattan(
    data = hg19_insulin_GWAS, assembly = "hg19",
    fill = c("grey", "#37a7db"),
    sigLine = FALSE,
    col = "grey", lty = 2, range = c(0, 14),
    x = 0.5, y = 0, width = 6.5, height = 2,
    just = c("left", "top"),
    default.units = "inches"
)
#> manhattan[manhattan1]
annoYaxis(
    plot = manhattanPlot, at = c(0, 2, 4, 6, 8, 10, 12, 14),
    axisLine = TRUE, fontsize = 8
)
#> yaxis[yaxis1]

## Annotate zoom lines for a region on chromsome 21
zoomRegion <- pgParams(
    chrom = "chr21",
    chromstart = 28000000, chromend = 30300000,
    assembly = "hg19"
)
annoZoomLines(
    plot = manhattanPlot, params = zoomRegion,
    y0 = 2, x1 = c(0.5, 7), y1 = 2.5, extend = c(0, 1.1),
    default.units = "inches",
    lty = 3
)
#> zoom[zoom1]

## Annotate highlight region for zoom region
annoHighlight(
    plot = manhattanPlot, params = zoomRegion,
    y = 2, height = 2, just = c("left", "bottom"),
    default.units = "inches",
    fill = "red", alpha = 0.8
)
#> highlight[highlight1]

## Plot Manhattan plot data and signal track under zoom lines
manhattanPlotZoom <- plotManhattan(
    data = hg19_insulin_GWAS,
    fill = "grey",
    sigLine = FALSE,
    baseline = TRUE,
    params = zoomRegion, range = c(0, 14),
    x = 0.5, y = 2.6,
    width = 6.5, height = 1
)
#> manhattan[manhattan2]
data("IMR90_ChIP_H3K27ac_signal")
signalPlot <- plotSignal(
    data = IMR90_ChIP_H3K27ac_signal, params = zoomRegion,
    range = c(0, 45),
    x = 0.5, y = "b0.1",
    width = 6.5, height = 0.65,
    just = c("left", "top"),
    default.units = "inches"
)
#> signal[signal1_h]

## Plot genome label
plotGenomeLabel(
    chrom = "chr21",
    chromstart = 28000000, chromend = 30300000,
    assembly = "hg19",
    x = 0.5, y = 4.4, length = 6.5,
    default.units = "inches"
)

#> genomeLabel[genomeLabel1]

## Hide page guides
pageGuideHide()
#> genomeLabel[genomeLabel1]
## Hide page guides
pageGuideHide()