Plot genomic coordinates along the x or y-axis of a plotgardener plot
Source:R/plotGenomeLabel.R
plotGenomeLabel.RdPlot genomic coordinates along the x or y-axis of a plotgardener plot
plotGenomeLabel(
    chrom,
    chromstart = NULL,
    chromend = NULL,
    assembly = "hg38",
    fontsize = 10,
    fontcolor = "black",
    linecolor = "black",
    margin = unit(1, "mm"),
    scale = "bp",
    commas = TRUE,
    sequence = TRUE,
    boxWidth = 0.5,
    axis = "x",
    at = NULL,
    tcl = 0.5,
    x,
    y,
    length,
    just = c("left", "top"),
    default.units = "inches",
    params = NULL,
    ...
)
Arguments
- chrom
Chromosome of genome label, as a string, or a character vector of chromosomes for a whole genome Manhattan plot.
- chromstart
Integer start of genome label.
- chromend
Integer end of genome label.
- assembly
Default genome assembly as a string or a assembly object.
- fontsize
A numeric specifying text fontsize in points. Default value is
fontsize = 10.- fontcolor
A character value indicating the color for text. Default value is
fontcolor = "black".- linecolor
A character value indicating the color of the genome label axis. Default value is
linecolor = "black".- margin
A numeric or unit vector specifying space between axis and coordinate labels. Default value is
margin = unit(1, "mm"),- scale
A character value indicating the scale of the coordinates along the genome label. Default value is
scale = "bp". Options are:"bp":base pairs.
"Kb":kilobase pairs. 1 kilobase pair is equal to 1000 base pairs.
"Mb":megabase pairs. 1 megabase pair is equal to 1000000 base pairs.
- commas
A logical value indicating whether to include commas in start and stop labels. Default value is
commas = TRUE.- sequence
A logical value indicating whether to include sequence information above the label of an x-axis (only at appropriate resolutions).
- boxWidth
A numeric value indicating the width of the boxes representing sequence information at appropriate resolutions. Default value is
boxWidth = 0.5.- axis
A character value indicating along which axis to add genome label. Sequence information will not be displayed along a y-axis. Default value is
axis = "x". Options are:"x":Genome label will be plotted along the x-axis.
"y":Genome label will be plotted along the y-axis. This is typically used for a square Hi-C plot made with
plotHicSquare.
- at
A numeric vector of x-value locations for tick marks.
- tcl
A numeric specifying the length of tickmarks as a fraction of text height. Default value is
tcl = 0.5.- x
A numeric or unit object specifying genome label x-location.
- y
A numeric, unit object, or character containing a "b" combined with a numeric value specifying genome label y-location. The character value will place the genome label y relative to the bottom of the most recently plotted plot according to the units of the plotgardener page.
- length
A numeric or unit object specifying length of genome label axis.
- just
Justification of genome label relative to its (x, y) location. If there are two values, the first value specifies horizontal justification and the second value specifies vertical justification. Possible string values are:
"left","right","centre","center","bottom", and"top". Default value isjust = c("left", "top").- default.units
A string indicating the default units to use if
x,y, orlengthare only given as numerics. Default value isdefault.units = "inches".- params
An optional pgParams object containing relevant function parameters.
- ...
Additional grid graphical parameters or digit specifications. See gpar and formatC.
Value
Returns a genomeLabel object containing
relevant genomic region, placement, and grob information.
Examples
## Load hg19 genomic annotation packages
library("TxDb.Hsapiens.UCSC.hg19.knownGene")
library("org.Hs.eg.db")
library("BSgenome.Hsapiens.UCSC.hg19")
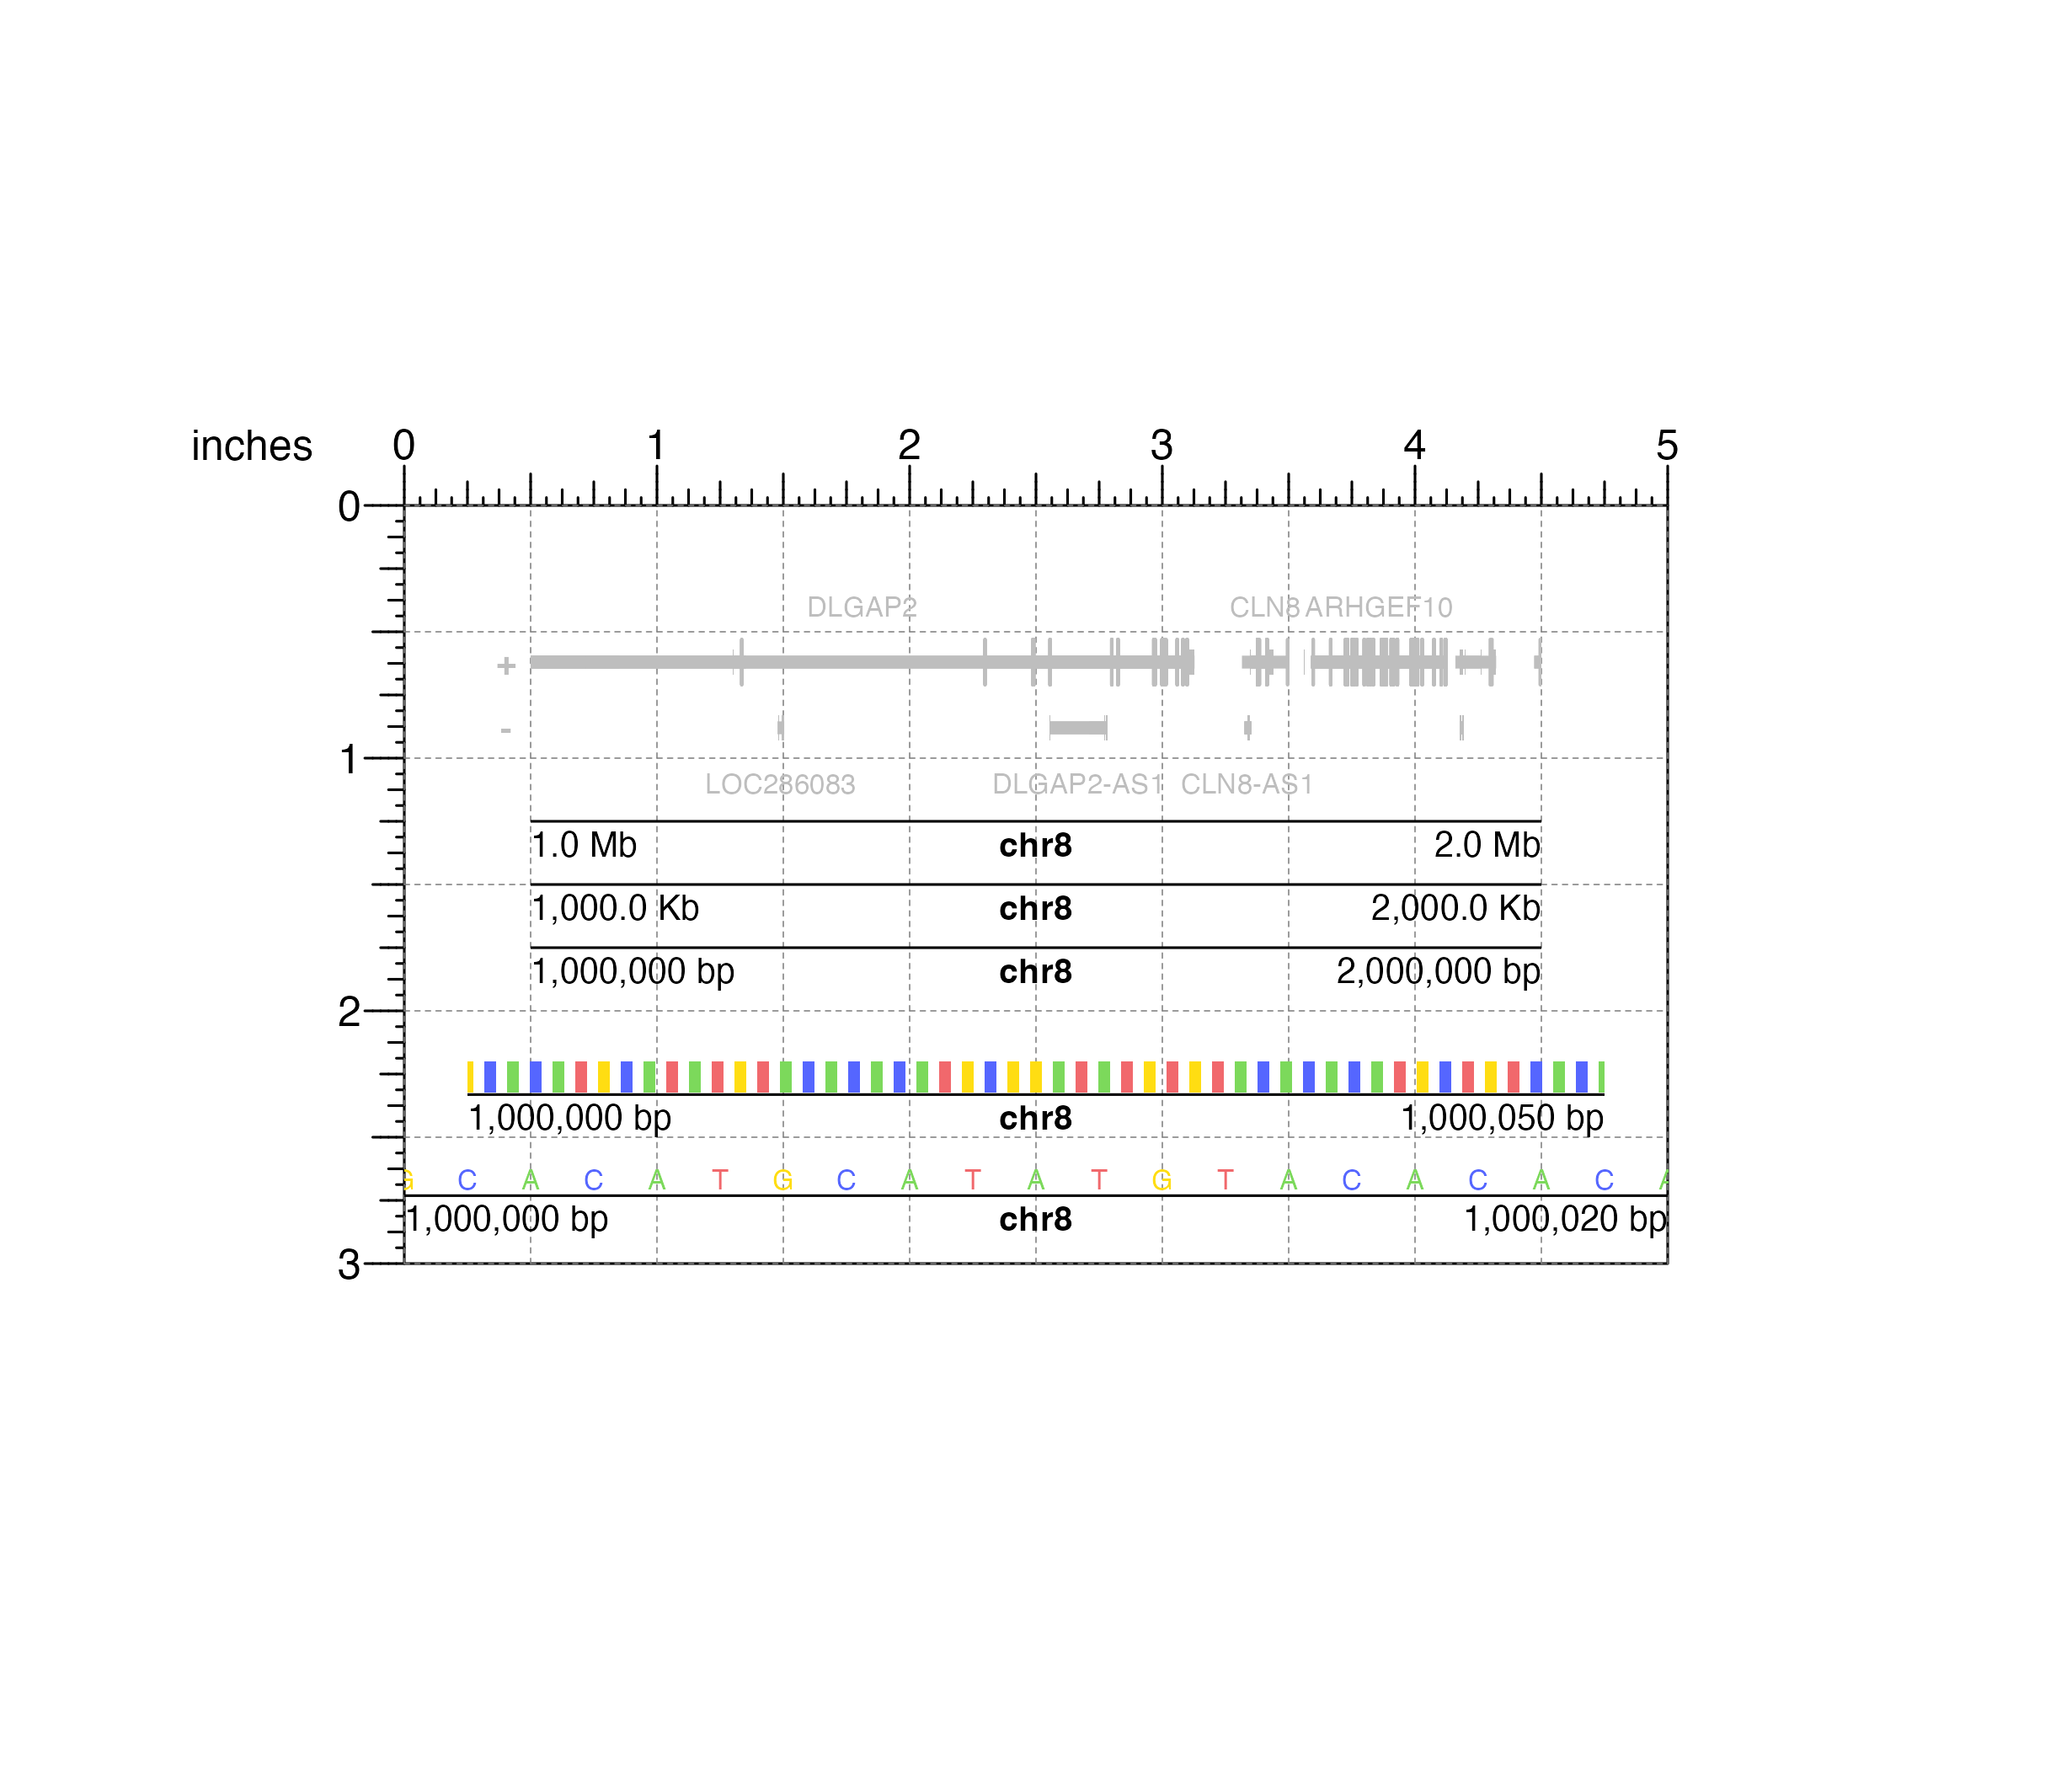
## Create page
pageCreate(width = 5, height = 3, default.units = "inches")
## Plot and place gene track on page
genesPlot <- plotGenes(
chrom = "chr8",
chromstart = 1000000, chromend = 2000000,
assembly = "hg19", fill = c("grey", "grey"),
fontcolor = c("grey", "grey"),
x = 0.5, y = 0.25, width = 4, height = 1,
just = c("left", "top"),
default.units = "inches"
)
#> genes[genes1]
## Plot x-axis genome labels at different scales
plotGenomeLabel(
chrom = "chr8",
chromstart = 1000000, chromend = 2000000,
assembly = "hg19",
scale = "Mb",
x = 0.5, y = 1.25, length = 4, just = c("left", "top"),
default.units = "inches"
)
#> genomeLabel[genomeLabel1]
plotGenomeLabel(
chrom = "chr8",
chromstart = 1000000, chromend = 2000000,
assembly = "hg19",
scale = "Kb",
x = 0.5, y = 1.5, length = 4, just = c("left", "top"),
default.units = "inches"
)
#> genomeLabel[genomeLabel2]
plotGenomeLabel(
chrom = "chr8",
chromstart = 1000000, chromend = 2000000,
assembly = "hg19",
scale = "bp",
x = 0.5, y = 1.75, length = 4, just = c("left", "top"),
default.units = "inches"
)
#> genomeLabel[genomeLabel3]
## Plot a different genomic label region, zooming in enough
## to see base pairs
plotGenomeLabel(
chrom = "chr8",
chromstart = 1000000, chromend = 1000050,
assembly = "hg19",
x = 0.25, y = 2.2, length = 4.5
)
#> genomeLabel[genomeLabel4]
plotGenomeLabel(
chrom = "chr8",
chromstart = 1000000, chromend = 1000020,
assembly = "hg19",
x = 0, y = 2.6, length = 5
)
 #> genomeLabel[genomeLabel6]
## Hide page guides
pageGuideHide()
#> genomeLabel[genomeLabel6]
## Hide page guides
pageGuideHide()
