Plot any kind of signal track data for a single chromosome
plotSignal(
    data,
    binSize = NA,
    binCap = TRUE,
    negData = FALSE,
    chrom,
    chromstart = NULL,
    chromend = NULL,
    assembly = "hg38",
    linecolor = "#37a7db",
    fill = NA,
    ymax = 1,
    range = NULL,
    scale = FALSE,
    label = NULL,
    bg = NA,
    baseline = TRUE,
    baseline.color = "grey",
    baseline.lwd = 1,
    orientation = "h",
    x = NULL,
    y = NULL,
    width = NULL,
    height = NULL,
    just = c("left", "top"),
    default.units = "inches",
    draw = TRUE,
    params = NULL,
    ...
)
Arguments
- data
Data to be plotted as a character value specifying a bigwig file path, a dataframe in BED format, or a GRanges object with metadata column
score. Either onedataargument or a list of two can be provided, where the seconddatawill be plotted below the x-axis if positive. The seconddatacan also be negative data.- binSize
A numeric specifying the length of each data bin in basepairs. Default value is
binSize = NA.- binCap
A logical value indicating whether the function will limit the number of data bins to 8,000. Default value is
binCap = TRUE.- negData
A logical value indicating whether the provided data has negative scores. Default value is
negData = FALSE.- chrom
Chromosome of region to be plotted, as a string.
- chromstart
Integer start position on chromosome to be plotted.
- chromend
Integer end position on chromosome to be plotted.
- assembly
Default genome assembly as a string or a assembly object. Default value is
assembly = "hg38".- linecolor
A character value or vector of length 2 specifying the line color(s) outlining the signal track(s). Default value is
linecolor = "#37a7db".- fill
A character value or vector of length 2 specifying the fill color(s) of the signal track(s). Default value is
fill = NA.- ymax
A numeric specifying the fraction of the max y-value to set as the height of the plot. Default value is
ymax = 1.- range
A numeric vector of length 2 specifying the y-range of data to plot (c(min, max)).
- scale
A logical value indicating whether to include a data scale label in the top left corner of the plot. Default value is
scale = FALSE.- label
An optional character value to conveniently add a text label to the plot. If
scale = TRUE, the label will be draw in the top right of the plot. Otherwise, the label will be drawn in the top left of the plot. For more customizable labels, use plotText. Default value islabel = NULL.- bg
Character value indicating background color. Default value is
bg = NA.- baseline
Logical value indicating whether to include a baseline along the x-axis. Default value is
baseline = TRUE.- baseline.color
Baseline color. Default value is
baseline.color = "grey".- baseline.lwd
Baseline line width. Default value is
baseline.lwd = 1.- orientation
A string specifying signal track orientation. Default value is
orientation = "h". Options are:"v":Vertical signal track orientation.
"h":Horizontal signal track orientation.
- x
A numeric or unit object specifying signal plot x-location.
- y
A numeric, unit object, or character containing a "b" combined with a numeric value specifying signal plot y-location. The character value will place the signal plot y relative to the bottom of the most recently plotted plot according to the units of the plotgardener page.
- width
A numeric or unit object specifying signal plot width.
- height
A numeric or unit object specifying signal plot height.
- just
Justification of signal plot relative to its (x, y) location. If there are two values, the first value specifies horizontal justification and the second value specifies vertical justification. Possible string values are:
"left","right","centre","center","bottom", and"top". Default value isjust = c("left", "top").- default.units
A string indicating the default units to use if
x,y,width, orheightare only given as numerics. Default value isdefault.units = "inches".- draw
A logical value indicating whether graphics output should be produced. Default value
draw = TRUE.- params
An optional pgParams object containing relevant function parameters.
- ...
Additional grid graphical parameters. See gpar.
Value
Returns a signal object containing relevant
genomic region, placement, and grob information.
Details
#A signal track can be placed on a plotgardener coordinate page by providing plot placement parameters:
plotSignal(data, chrom,
            chromstart = NULL, chromend = NULL,
            x, y, width, height, just = c("left", "top"),
            default.units = "inches")
This function can also be used to quickly plot an unannotated signal track by ignoring plot placement parameters:
plotSignal(data, chrom,
            chromstart = NULL, chromend = NULL)
Examples
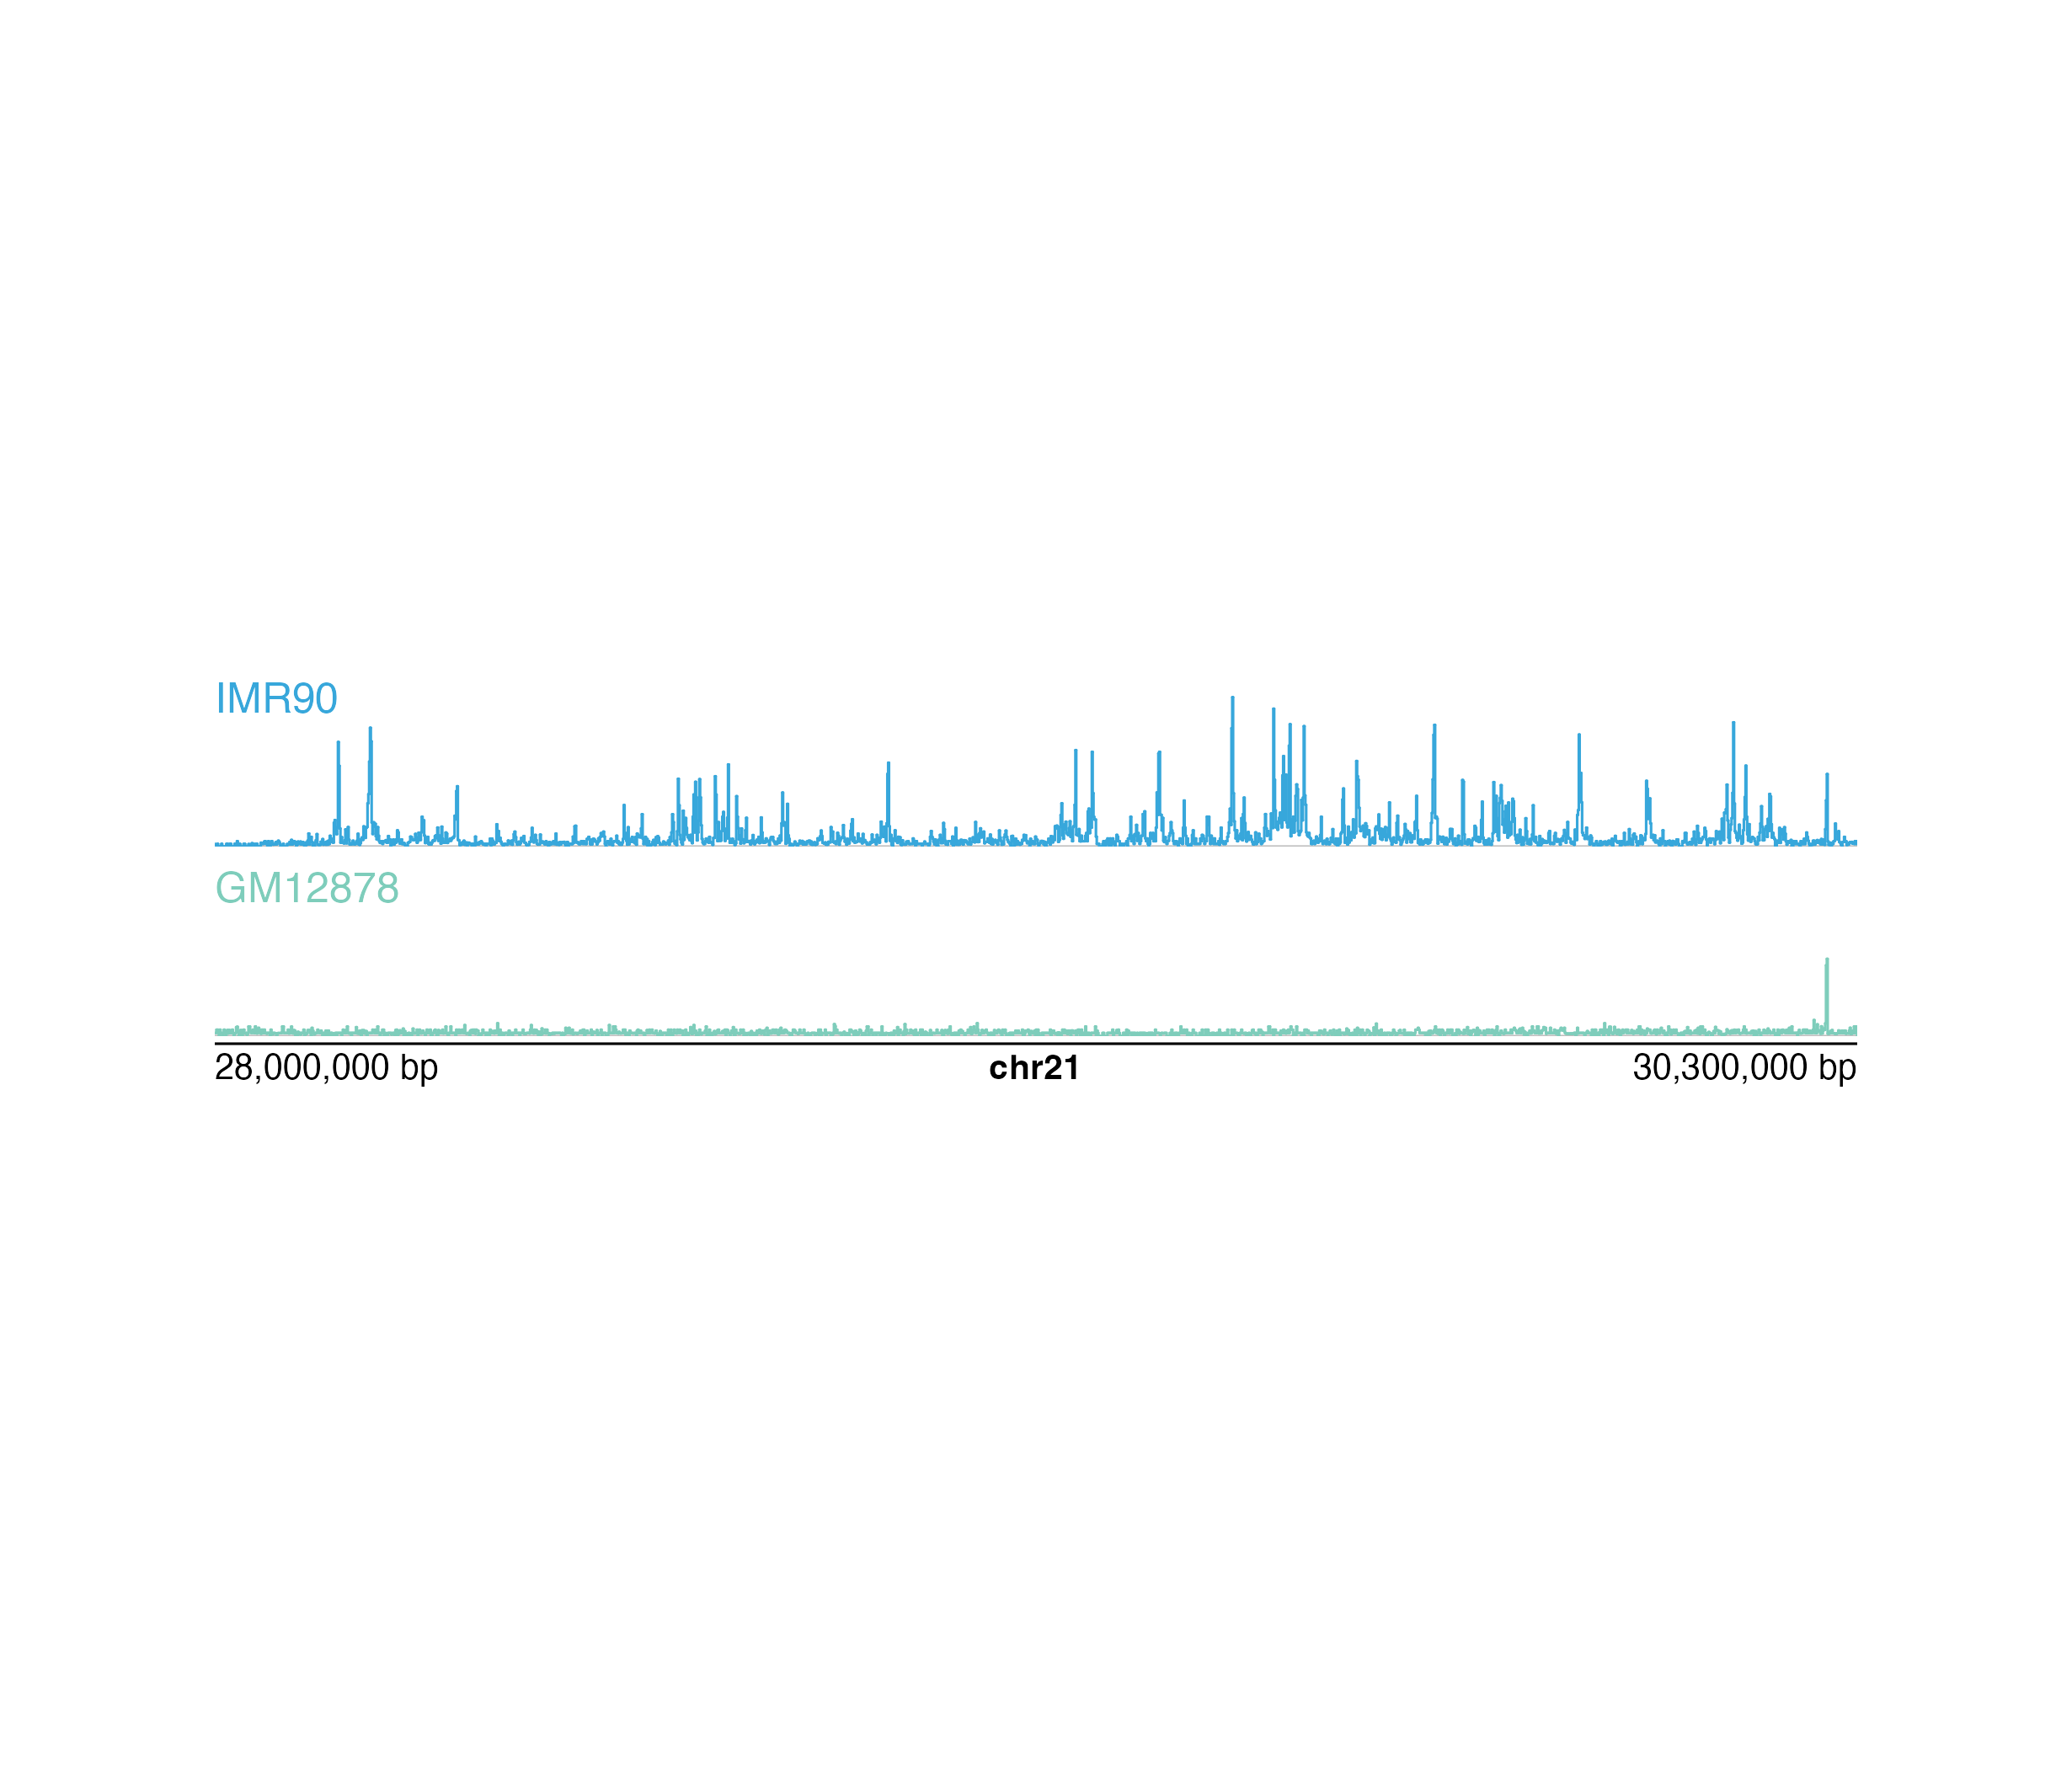
## Load signal data
library(plotgardenerData)
data("IMR90_ChIP_H3K27ac_signal")
data("GM12878_ChIP_H3K27ac_signal")
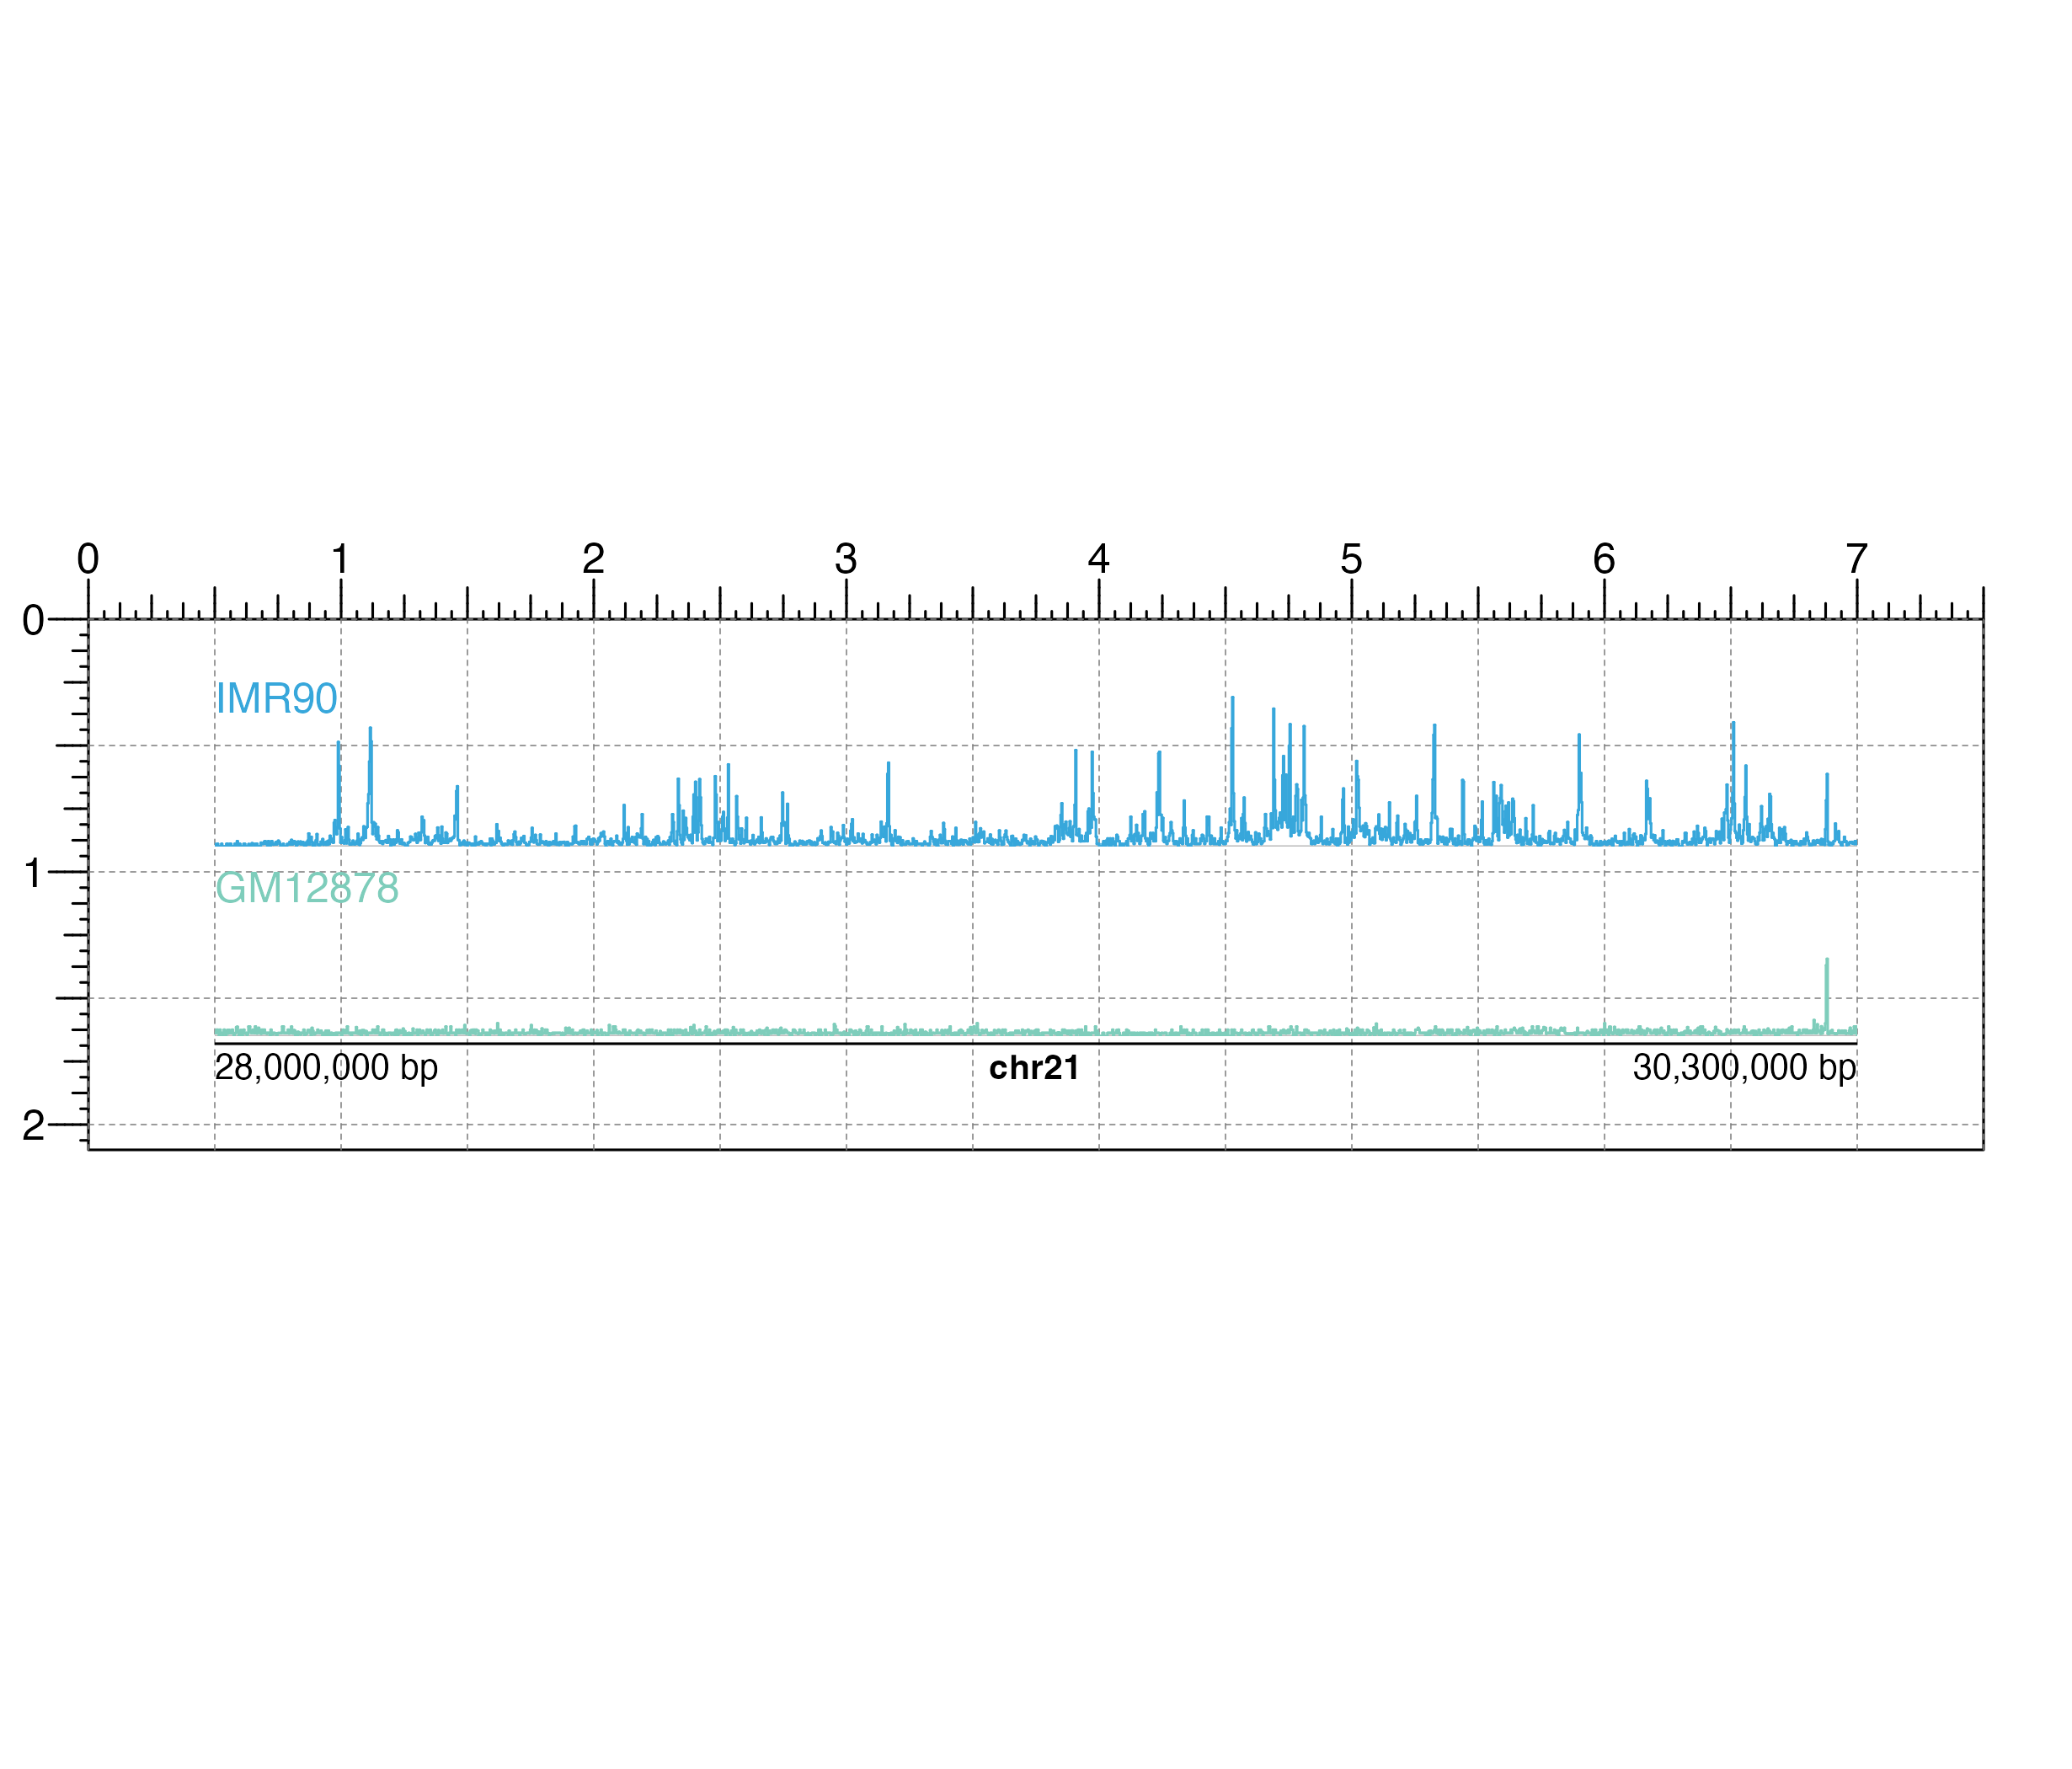
## Create a page
pageCreate(width = 7.5, height = 2.1, default.units = "inches")
## Define region
region <- pgParams(
chrom = "chr21",
chromstart = 28000000, chromend = 30300000,
assembly = "hg19",
range = c(0, 45)
)
## Plot and place signal plots
signal1 <- plotSignal(
data = IMR90_ChIP_H3K27ac_signal, params = region,
x = 0.5, y = 0.25, width = 6.5, height = 0.65,
just = c("left", "top"), default.units = "inches"
)
#> signal[signal1_h]
signal2 <- plotSignal(
data = GM12878_ChIP_H3K27ac_signal, params = region,
linecolor = "#7ecdbb",
x = 0.5, y = 1, width = 6.5, height = 0.65,
just = c("left", "top"), default.units = "inches"
)
#> signal[signal2_h]
## Plot genome label
plotGenomeLabel(
chrom = "chr21",
chromstart = 28000000, chromend = 30300000,
assembly = "hg19",
x = 0.5, y = 1.68, length = 6.5,
default.units = "inches"
)
#> genomeLabel[genomeLabel1]
## Add text labels
plotText(
label = "IMR90", fonsize = 10, fontcolor = "#37a7db",
x = 0.5, y = 0.25, just = c("left", "top"),
default.units = "inches"
)
#> text[text1]
plotText(
label = "GM12878", fonsize = 10, fontcolor = "#7ecdbb",
x = 0.5, y = 1, just = c("left", "top"),
default.units = "inches"
)
 #> text[text2]
## Hide page guides
pageGuideHide()
#> text[text2]
## Hide page guides
pageGuideHide()