Plot text within a plotgardener layout
plotText(
    label,
    fontcolor = "black",
    fontsize = 12,
    rot = 0,
    check.overlap = FALSE,
    x,
    y,
    just = "center",
    default.units = "inches",
    params = NULL,
    ...
)
Arguments
- label
Character or expression of text to be plotted.
- fontcolor
A character value specifying text fontcolor. Default value is
fontcolor = "black".- fontsize
A numeric specifying text fontsize in points. Default value is
fontsize = 12.- rot
A numeric specifying the angle to rotate the text. Default value is
rot = 0.- check.overlap
A logical value to indicate whether to check for and omit overlapping text. Default value is
check.overlap = FALSE.- x
A numeric vector or unit object specifying text x-location.
- y
A numeric vector, unit object, or a character vector of values containing a "b" combined with a numeric value specifying text y-locations. The character vector will place text y-locations relative to the bottom of the most recently plotted plot according to the units of the plotgardener page.
- just
Justification of text relative to its (x, y) location. If there are two values, the first value specifies horizontal justification and the second value specifies vertical justification. Possible string values are:
"left","right","centre","center","bottom", and"top". Default value isjust = "center".- default.units
A string indicating the default units to use if
xoryare only given as numerics or numeric vectors. Default value isdefault.units = "inches".- params
An optional pgParams object containing relevant function parameters.
- ...
Additional grid graphical parameters. See gpar.
Value
Returns a text object containing relevant
placement and grob information.
See also
Examples
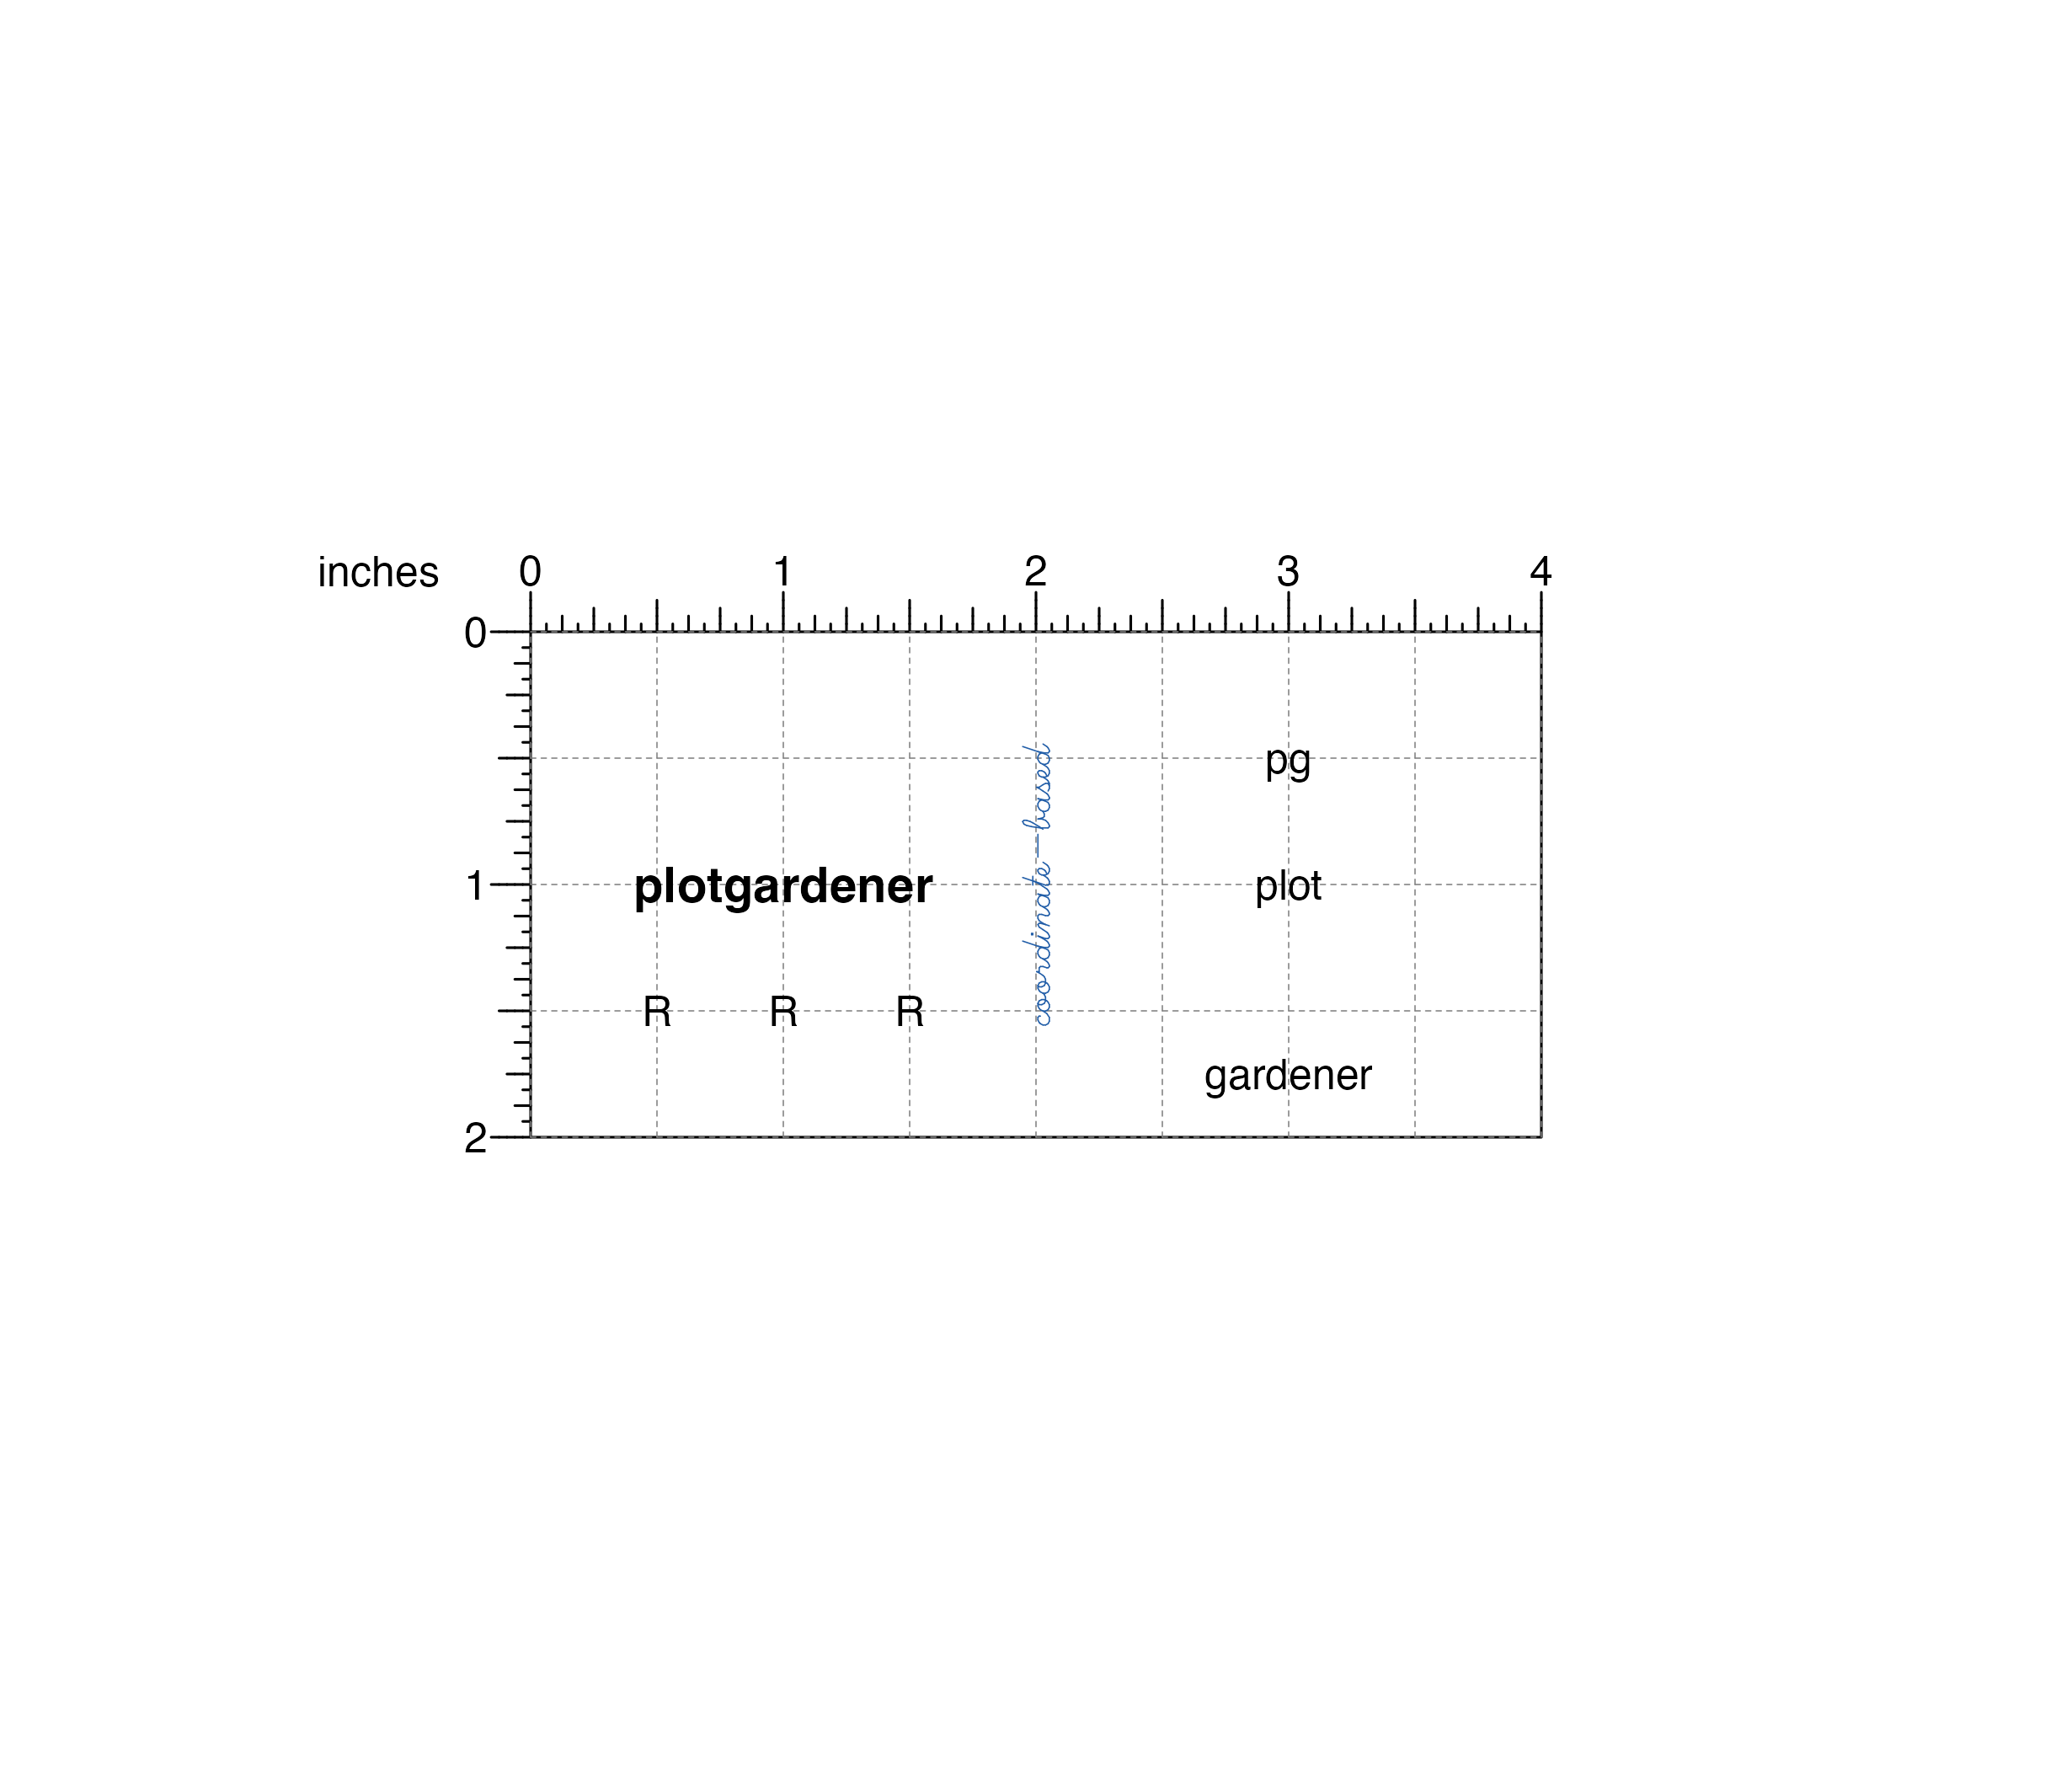
## Create a page
pageCreate(width = 4, height = 2, default.units = "inches")

## Plot text, adjusting fontsize and fontface
plotText(
    label = "plotgardener", fontsize = 14, fontface = "bold",
    x = 1, y = 1, just = "center", default.units = "inches"
)
#> text[text1]

## Plot text, adjusting color, rotation, and fontfamily
plotText(
    label = "coordinate-based", fontcolor = "#225EA8", rot = 90,
    fontfamily = "HersheyScript", x = 2, y = 1, just = "center",
    default.units = "inches"
)
#> text[text2]

## Plot a text label in multiple places at once
plotText(
    label = "R", x = c(0.5, 1, 1.5), y = 1.5, just = "center",
    default.units = "inches"
)
#> text[text2]

## Plot a vector of text labels
plotText(
    label = c("pg", "plot", "gardener"), x = 3, y = c(0.5, 1, 1.75),
    just = "center", default.units = "inches"
)

#> text[text2]

## Hide page guides
pageGuideHide()
#> text[text2]
## Hide page guides
pageGuideHide()