Add a y-axis to a plot
annoYaxis(
    plot,
    at = NULL,
    label = TRUE,
    main = TRUE,
    scipen = 999,
    axisLine = FALSE,
    params = NULL,
    ...
)
Arguments
- plot
Plot object to annotate with y-axis.
- at
A numeric vector of y-value locations for tick marks.
- label
A logical value indicating whether to draw the labels on the tick marks, or an expression or character vector which specify the labels to use. If not logical, must be the same length as the
atargument.- main
A logical value indicating whether to draw the y-axis at the left of the plot. Default value is
main = TRUE. Options are:TRUE:y-axis is drawn at the left of the plot.
FALSE:y-axis is drawn at the right of the plot.
- scipen
An integer indicating the penalty to be applied when deciding to print numeric values in fixed or exponential notation. Default value is
scipen = 999.- axisLine
A logical value indicating whether to show the axis line. Default value is
axisLine = FALSE.- params
An optional pgParams object containing relevant function parameters.
- ...
Additional grid graphical parameters. See gpar.
Value
Returns a yaxis object containing
relevant grob information.
Examples
## Load Hi-C data
library(plotgardenerData)
data("IMR90_HiC_10kb")
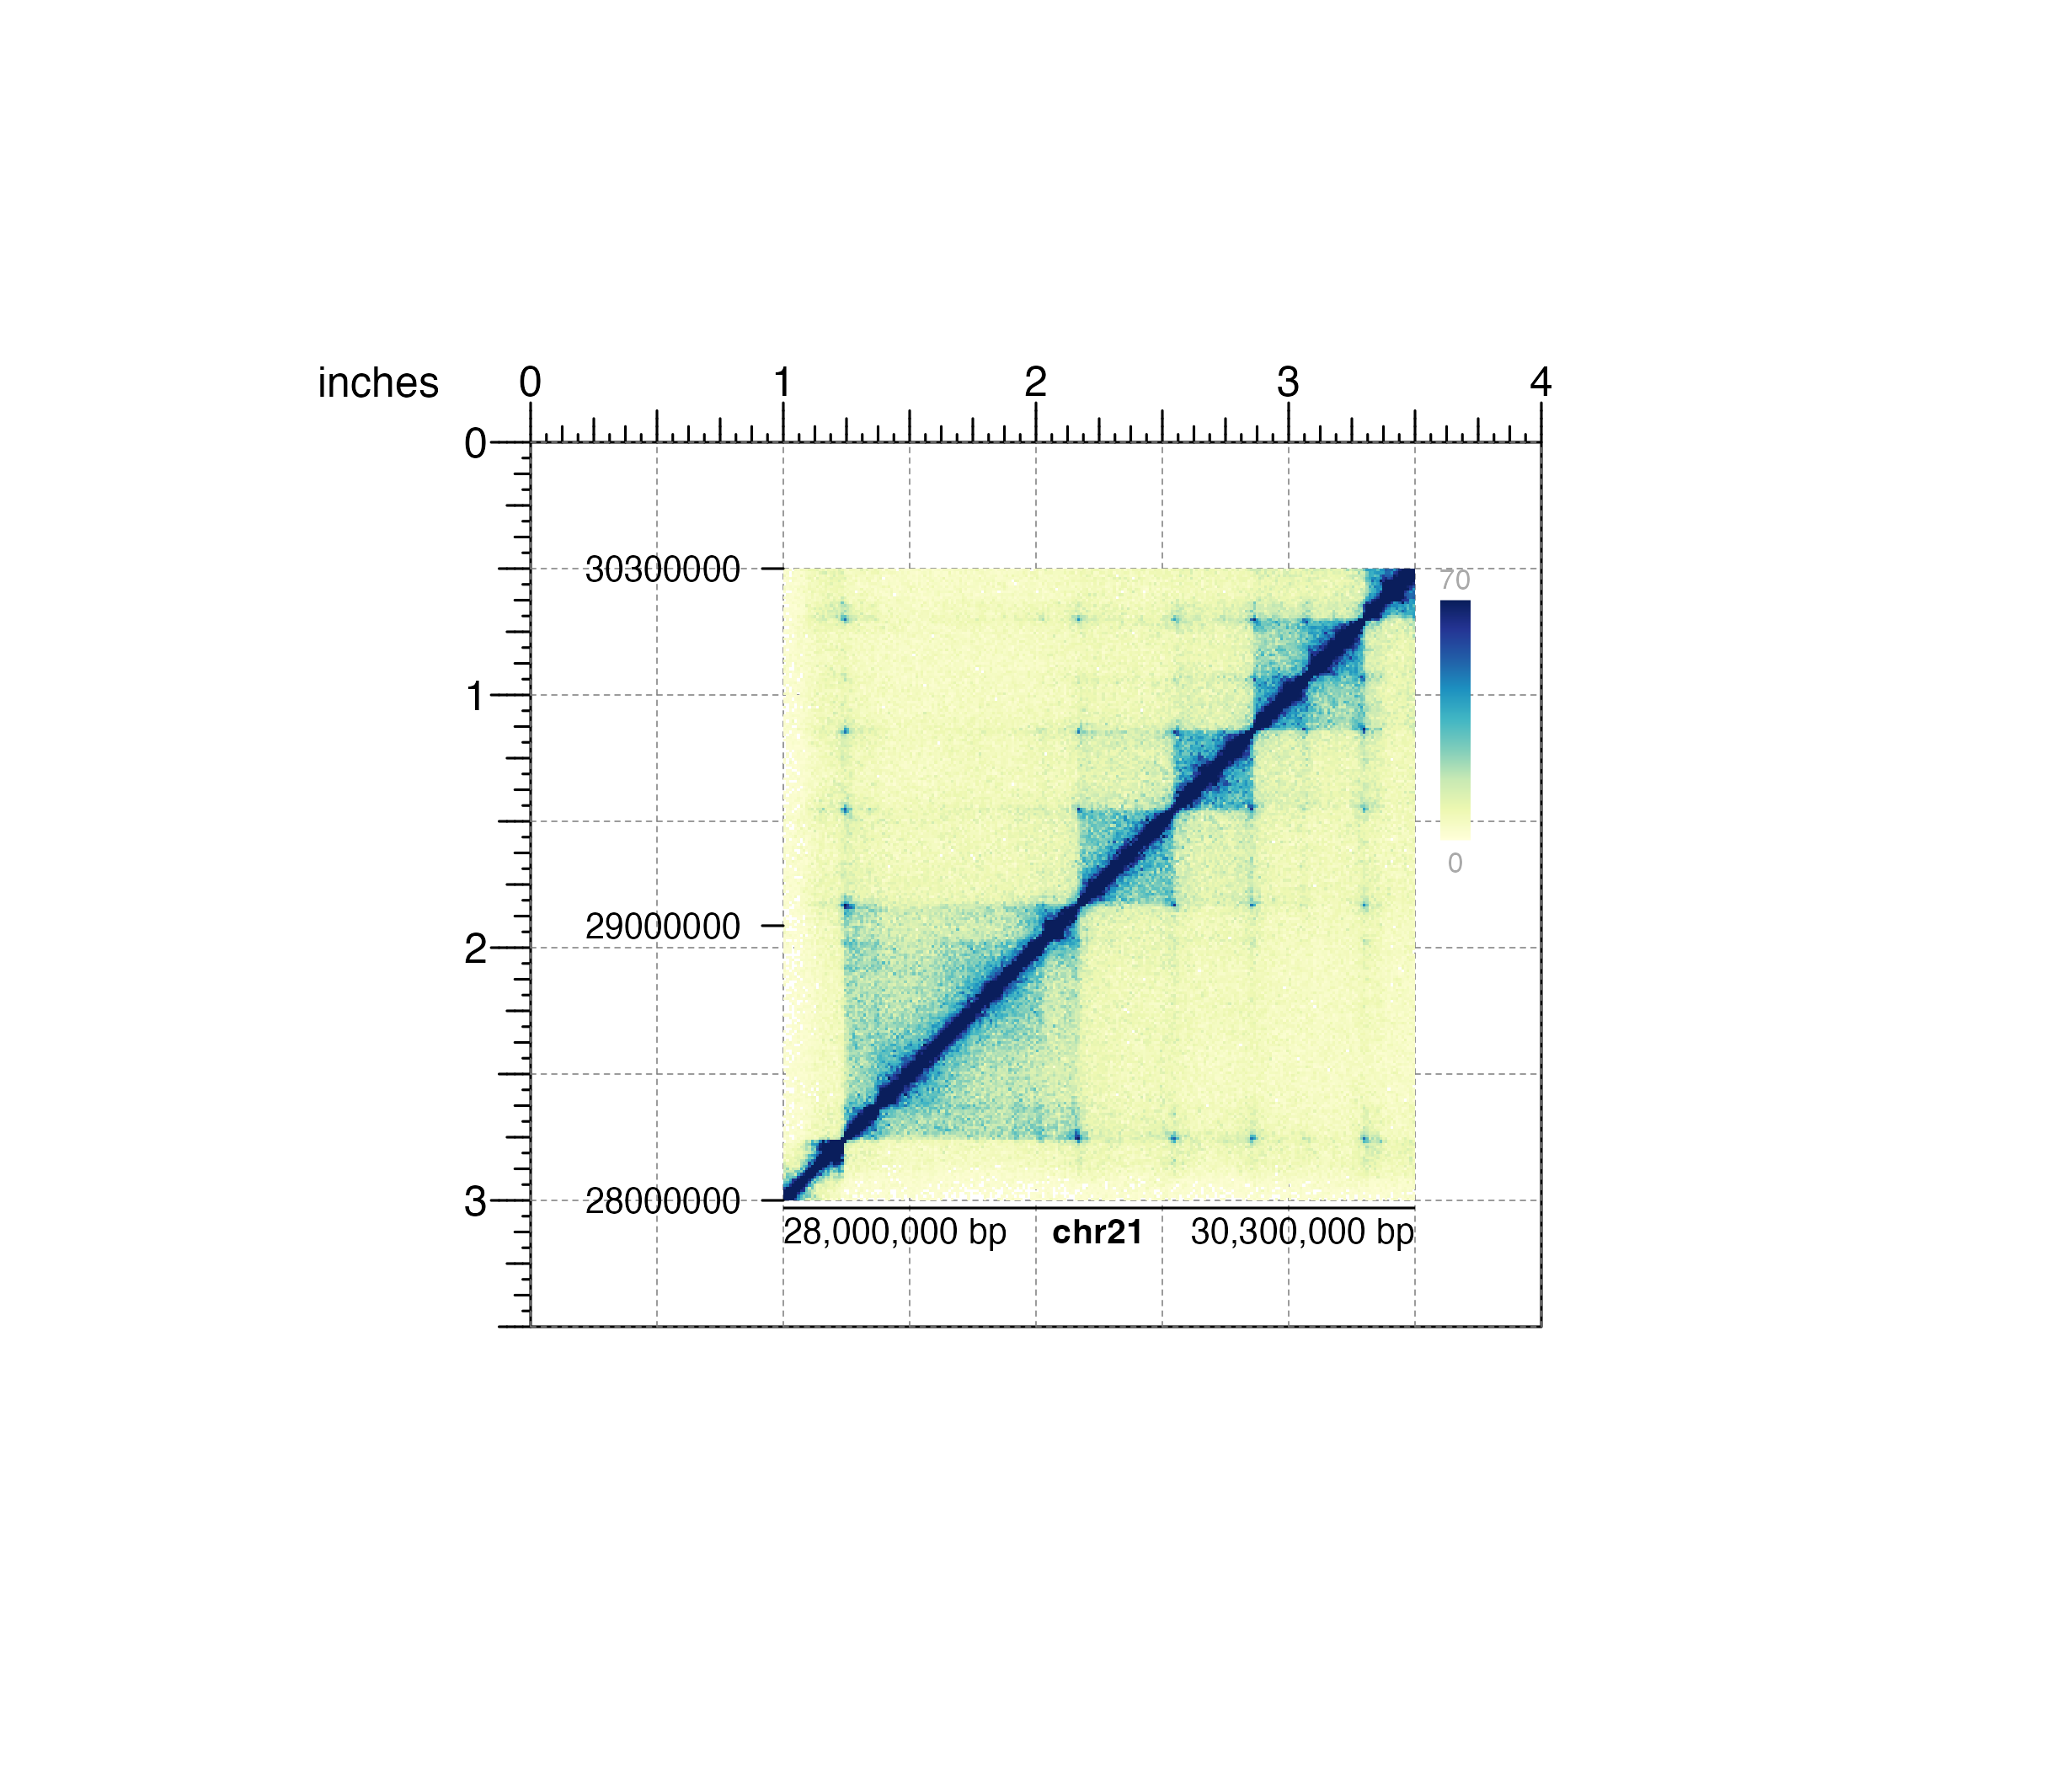
## Create page
pageCreate(width = 4, height = 3.5, default.units = "inches")
## Plot and place a square Hi-C plot
hicPlot <- plotHicSquare(
data = IMR90_HiC_10kb, resolution = 10000,
zrange = c(0, 70),
chrom = "chr21",
chromstart = 28000000, chromend = 30300000,
assembly = "hg19",
x = 1, y = 0.5, width = 2.5, height = 2.5,
just = c("left", "top"),
default.units = "inches"
)
#> Read in dataframe. Assuming 'chrom' in column1 and 'altchrom' in column2. 10000 BP resolution detected.
#> hicSquare[hicSquare1]
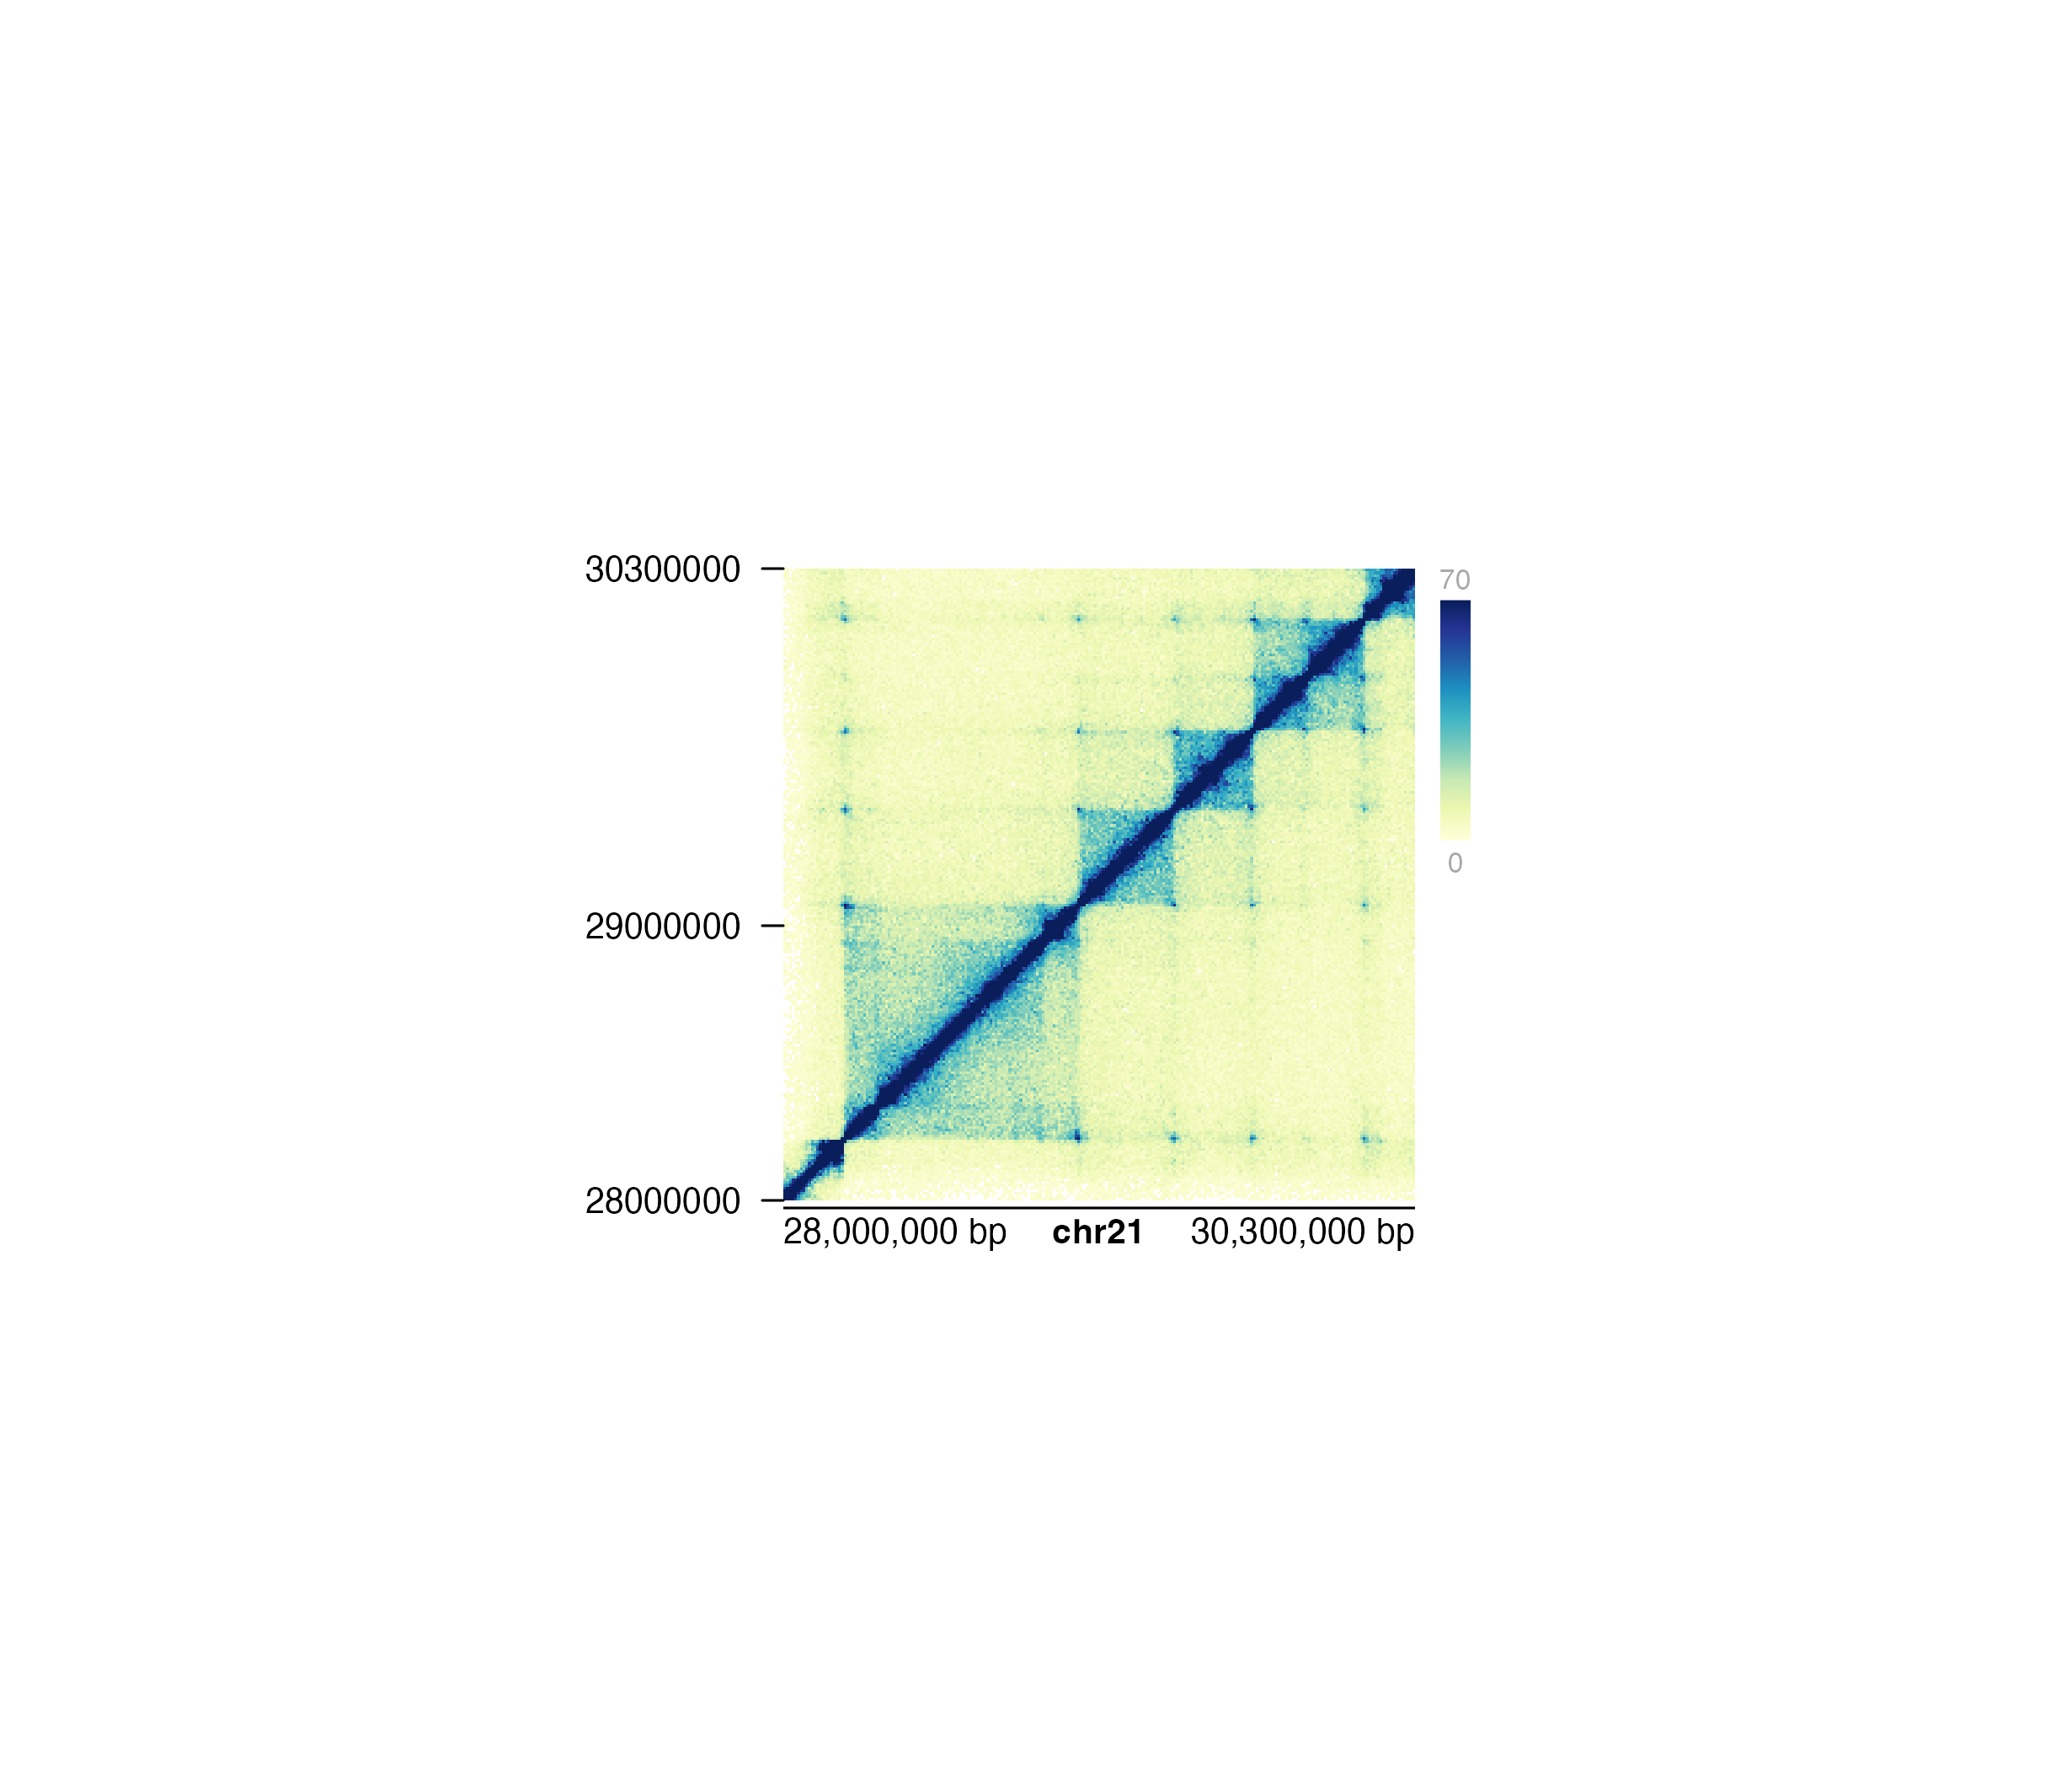
## Add standard y-axis to Hi-C plot
annoYaxis(
plot = hicPlot, at = c(28000000, 29000000, 30300000),
fontsize = 10
)
#> yaxis[yaxis1]
## Annotate genome label on x-axis
annoGenomeLabel(plot = hicPlot, x = 1, y = 3.03)
#> genomeLabel[genomeLabel1]
## Annotate heatmap legend
annoHeatmapLegend(
plot = hicPlot,
x = 3.6, y = 0.5, width = 0.12, height = 1.2
)
 #> heatmapLegend[heatmapLegend1]
## Hide page guides
pageGuideHide()
#> heatmapLegend[heatmapLegend1]
## Hide page guides
pageGuideHide()