Add a color scale legend for heatmap-style plots
annoHeatmapLegend(
    plot,
    orientation = "v",
    fontsize = 8,
    fontcolor = "dark grey",
    scientific = FALSE,
    digits = 1,
    ticks = FALSE,
    breaks = NULL,
    border = FALSE,
    x,
    y,
    width,
    height,
    just = c("left", "top"),
    default.units = "inches",
    params = NULL,
    ...
)
Arguments
- plot
Heatmap-style plot object to add heatmap legend for.
- orientation
A string specifying legend orientation. Default value is
orientation = "v". Options are:"v":Vertical legend orientation.
"h":Horizontal legend orientation.
- fontsize
A numeric specifying text fontsize in points. Default value is
fontsize = 8.- fontcolor
Character value specfying text fontcolor. Default value is
fontcolor = "dark grey".- scientific
Logical value specifying if numeric color value labels should be encoded in scientific format. Default value is
scientific = FALSE.- digits
Numeric specifying how many significant digits to include of numeric color value labels. Default value is
digits = 1.- ticks
Logical value specifying if tick marks on the heatmap colorbar should be visible. Default value is
ticks = FALSE.- breaks
A numeric vector specifying tick breaks. Default value is
breaks = NULL.- border
Logical value indicating whether to add a border around heatmap legend. Default value is
border = FALSE.- x
A numeric or unit object specifying x-location of legend.
- y
A numeric, unit object, or character containing a "b" combined with a numeric value specifying y-location of legend. The character value will place the legend y relative to the bottom of the most recently plotted plot according to the units of the plotgardener page.
- width
A numeric or unit object specifying width of legend.
- height
A numeric or unit object specifying height of legend.
- just
Justification of heatmap legend relative to its (x, y) location. If there are two values, the first value specifies horizontal justification and the second value specifies vertical justification. Possible string values are:
"left","right","centre","center","bottom", and"top". Default value isjust = c("left", "top").- default.units
A string indicating the default units to use if
x,y,width, orheightare only given as numerics. Default value isdefault.units = "inches".- params
An optional pgParams object containing relevant function parameters.
- ...
Additional grid graphical parameters. See gpar.
Value
Returns a heatmapLegend object with relevant
color value, placement, and grob information.
Examples
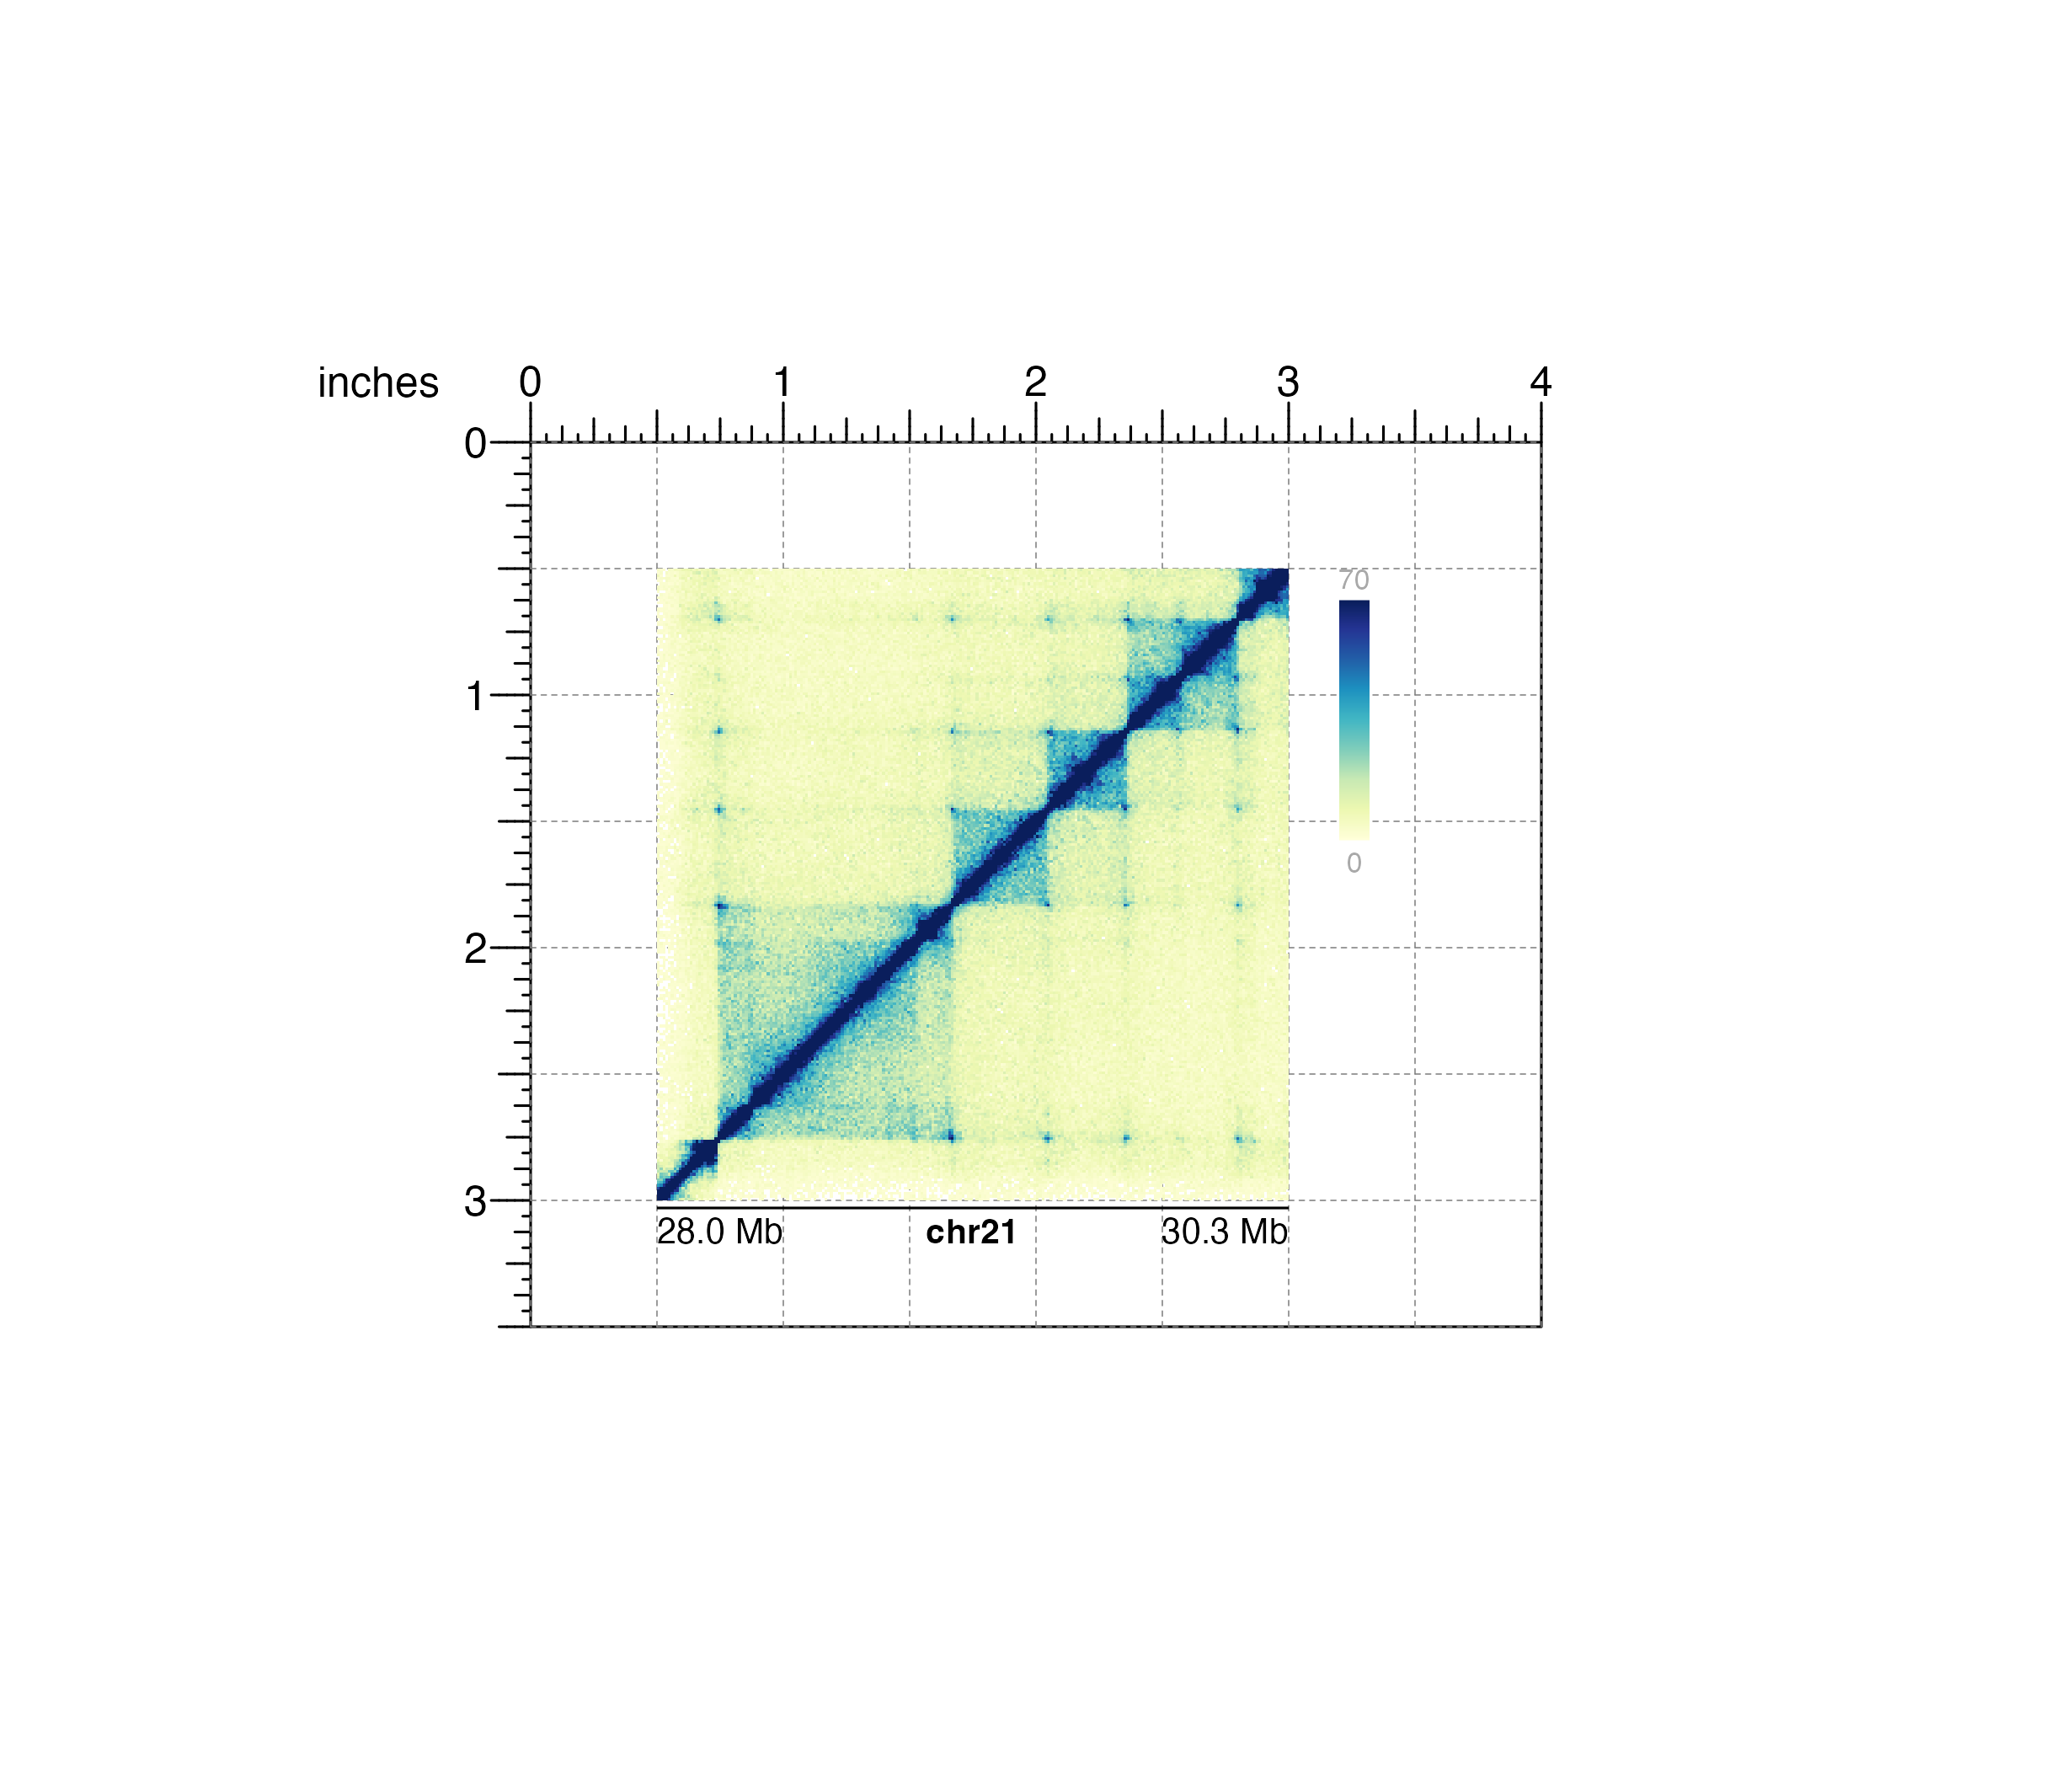
## Load Hi-C data
library(plotgardenerData)
data("IMR90_HiC_10kb")

## Create page
pageCreate(width = 4, height = 3.5, default.units = "inches")

## Plot and place a square Hi-C plot
hicPlot <- plotHicSquare(
    data = IMR90_HiC_10kb, resolution = 10000,
    zrange = c(0, 70),
    chrom = "chr21",
    chromstart = 28000000, chromend = 30300000,
    assembly = "hg19",
    x = 0.5, y = 0.5, width = 2.5, height = 2.5,
    just = c("left", "top"),
    default.units = "inches"
)
#> Read in dataframe.  Assuming 'chrom' in column1 and 'altchrom' in column2. 10000 BP resolution detected.
#> hicSquare[hicSquare1]

## Add heatmap legend
annoHeatmapLegend(
    plot = hicPlot,
    x = 3.2, y = 0.5, width = 0.12, height = 1.2,
    just = c("left", "top"), default.units = "inches"
)
#> heatmapLegend[heatmapLegend1]

## Annotate genome label
annoGenomeLabel(
    plot = hicPlot, x = 0.5, y = 3.03, scale = "Mb",
    just = c("left", "top")
)

#> genomeLabel[genomeLabel1]

## Hide page guides
pageGuideHide()
#> genomeLabel[genomeLabel1]
## Hide page guides
pageGuideHide()
