Plot a Hi-C interaction matrix in a square format
plotHicSquare(
    data,
    resolution = "auto",
    zrange = NULL,
    norm = "KR",
    matrix = "observed",
    chrom,
    chromstart = NULL,
    chromend = NULL,
    altchrom = NULL,
    altchromstart = NULL,
    altchromend = NULL,
    assembly = "hg38",
    palette = colorRampPalette(brewer.pal(n = 9, "YlGnBu")),
    colorTrans = "linear",
    half = "both",
    yaxisDir = "increase",
    bg = NA,
    x = NULL,
    y = NULL,
    width = NULL,
    height = NULL,
    just = c("left", "top"),
    default.units = "inches",
    draw = TRUE,
    params = NULL,
    quiet = FALSE
)
Arguments
- data
Path to .hic or .(m)cool file as a string or a 3-column dataframe of interaction counts in sparse upper triangular format.
- resolution
A numeric specifying the width in basepairs of each pixel. For files, "auto" will attempt to choose a resolution based on the size of the region. For dataframes, "auto" will attempt to detect the resolution the dataframe contains.
- zrange
A numeric vector of length 2 specifying the range of interaction scores to plot, where extreme values will be set to the max or min.
- norm
Character value specifying hic data normalization method, if giving .hic or .(m)cool file. This value must be found in the .hic or .(m)cool file. Default value is
norm = "KR".- matrix
Character value indicating the type of matrix to output for .hic files. Default value is
matrix = "observed". Options are:"observed":Observed counts.
"oe":Observed/expected counts.
"log2oe":Log2 transformed observed/expected counts.
- chrom
Chromosome of region to be plotted, as a string.
- chromstart
Integer start position on chromosome to be plotted.
- chromend
Integer end position on chromosome to be plotted.
- altchrom
Alternate chromosome for off-diagonal plotting or interchromosomal plotting, as a string.
- altchromstart
Alternate chromosome integer start position for off-diagonal plotting or interchromosomal plotting.
- altchromend
Alternate chromosome integer end position for off-diagonal plotting or interchromosomal plotting.
- assembly
Default genome assembly as a string or a assembly object. Default value is
assembly = "hg38".- palette
A function describing the color palette to use for representing scale of interaction scores. Default value is
palette = colorRampPalette(brewer.pal(n = 9, "YlGnBu")).- colorTrans
A string specifying how to scale Hi-C colors. Options are "linear", "log", "log2", or "log10". Default value is
colorTrans = "linear".- half
A character value indicating which diagonal regions to plot. For intrachromosomal plotting, options are
"both","top", or"bottom". For off-diagonal or interchromosomal plotting, options are"top"or"bottom". Default value ishalf = "both"."both":Both diagonal halves.
"top":Half above the diagonal.
"bottom":Half below the diagonal.
- yaxisDir
A string specifying the genomic direction of the y-axis. Options are
"increase", where the bottom left corner of the Hi-C map indicates the origin, and"decrease", where the top left corner of the Hi-C map indicates the origin. This will change the direction of the diagonal for intrachromosomal maps. Default value isyaxisDir = "increase".- bg
Character value indicating background color. Default value is
bg = NA.- x
A numeric or unit object specifying square Hi-C plot x-location.
- y
A numeric, unit object, or character containing a "b" combined with a numeric value specifying square Hi-C plot y-location. The character value will place the square Hi-C plot y relative to the bottom of the most recently plotted plot according to the units of the plotgardener page.
- width
A numeric or unit object specifying square Hi-C plot width.
- height
A numeric or unit object specifying square Hi-C plot height.
- just
Justification of square Hi-C plot relative to its (x, y) location. If there are two values, the first value specifies horizontal justification and the second value specifies vertical justification. Possible string values are:
"left","right","centre","center","bottom", and"top". Default value isjust = c("left", "top").- default.units
A string indicating the default units to use if
x,y,width, orheightare only given as numerics. Default value isdefault.units = "inches".- draw
A logical value indicating whether graphics output should be produced. Default value is
draw = TRUE.- params
An optional pgParams object containing relevant function parameters.
- quiet
A logical indicating whether or not to print messages.
Value
Returns a hicSquare object containing relevant
genomic region, Hi-C data, placement, and grob information.
Details
A square Hi-C plot can be placed on a plotgardener coordinate page by providing plot placement parameters:
plotHicSquare(data, chrom,
                chromstart = NULL, chromend = NULL,
                x, y, width, height, just = c("left", "top"),
                default.units = "inches")
This function can be used to quickly plot an unannotated square Hi-C plot by ignoring plot placement parameters:
plotHicSquare(data, chrom,
chromstart = NULL, chromend = NULL)Examples
## Load Hi-C data
library(plotgardenerData)
data("IMR90_HiC_10kb")
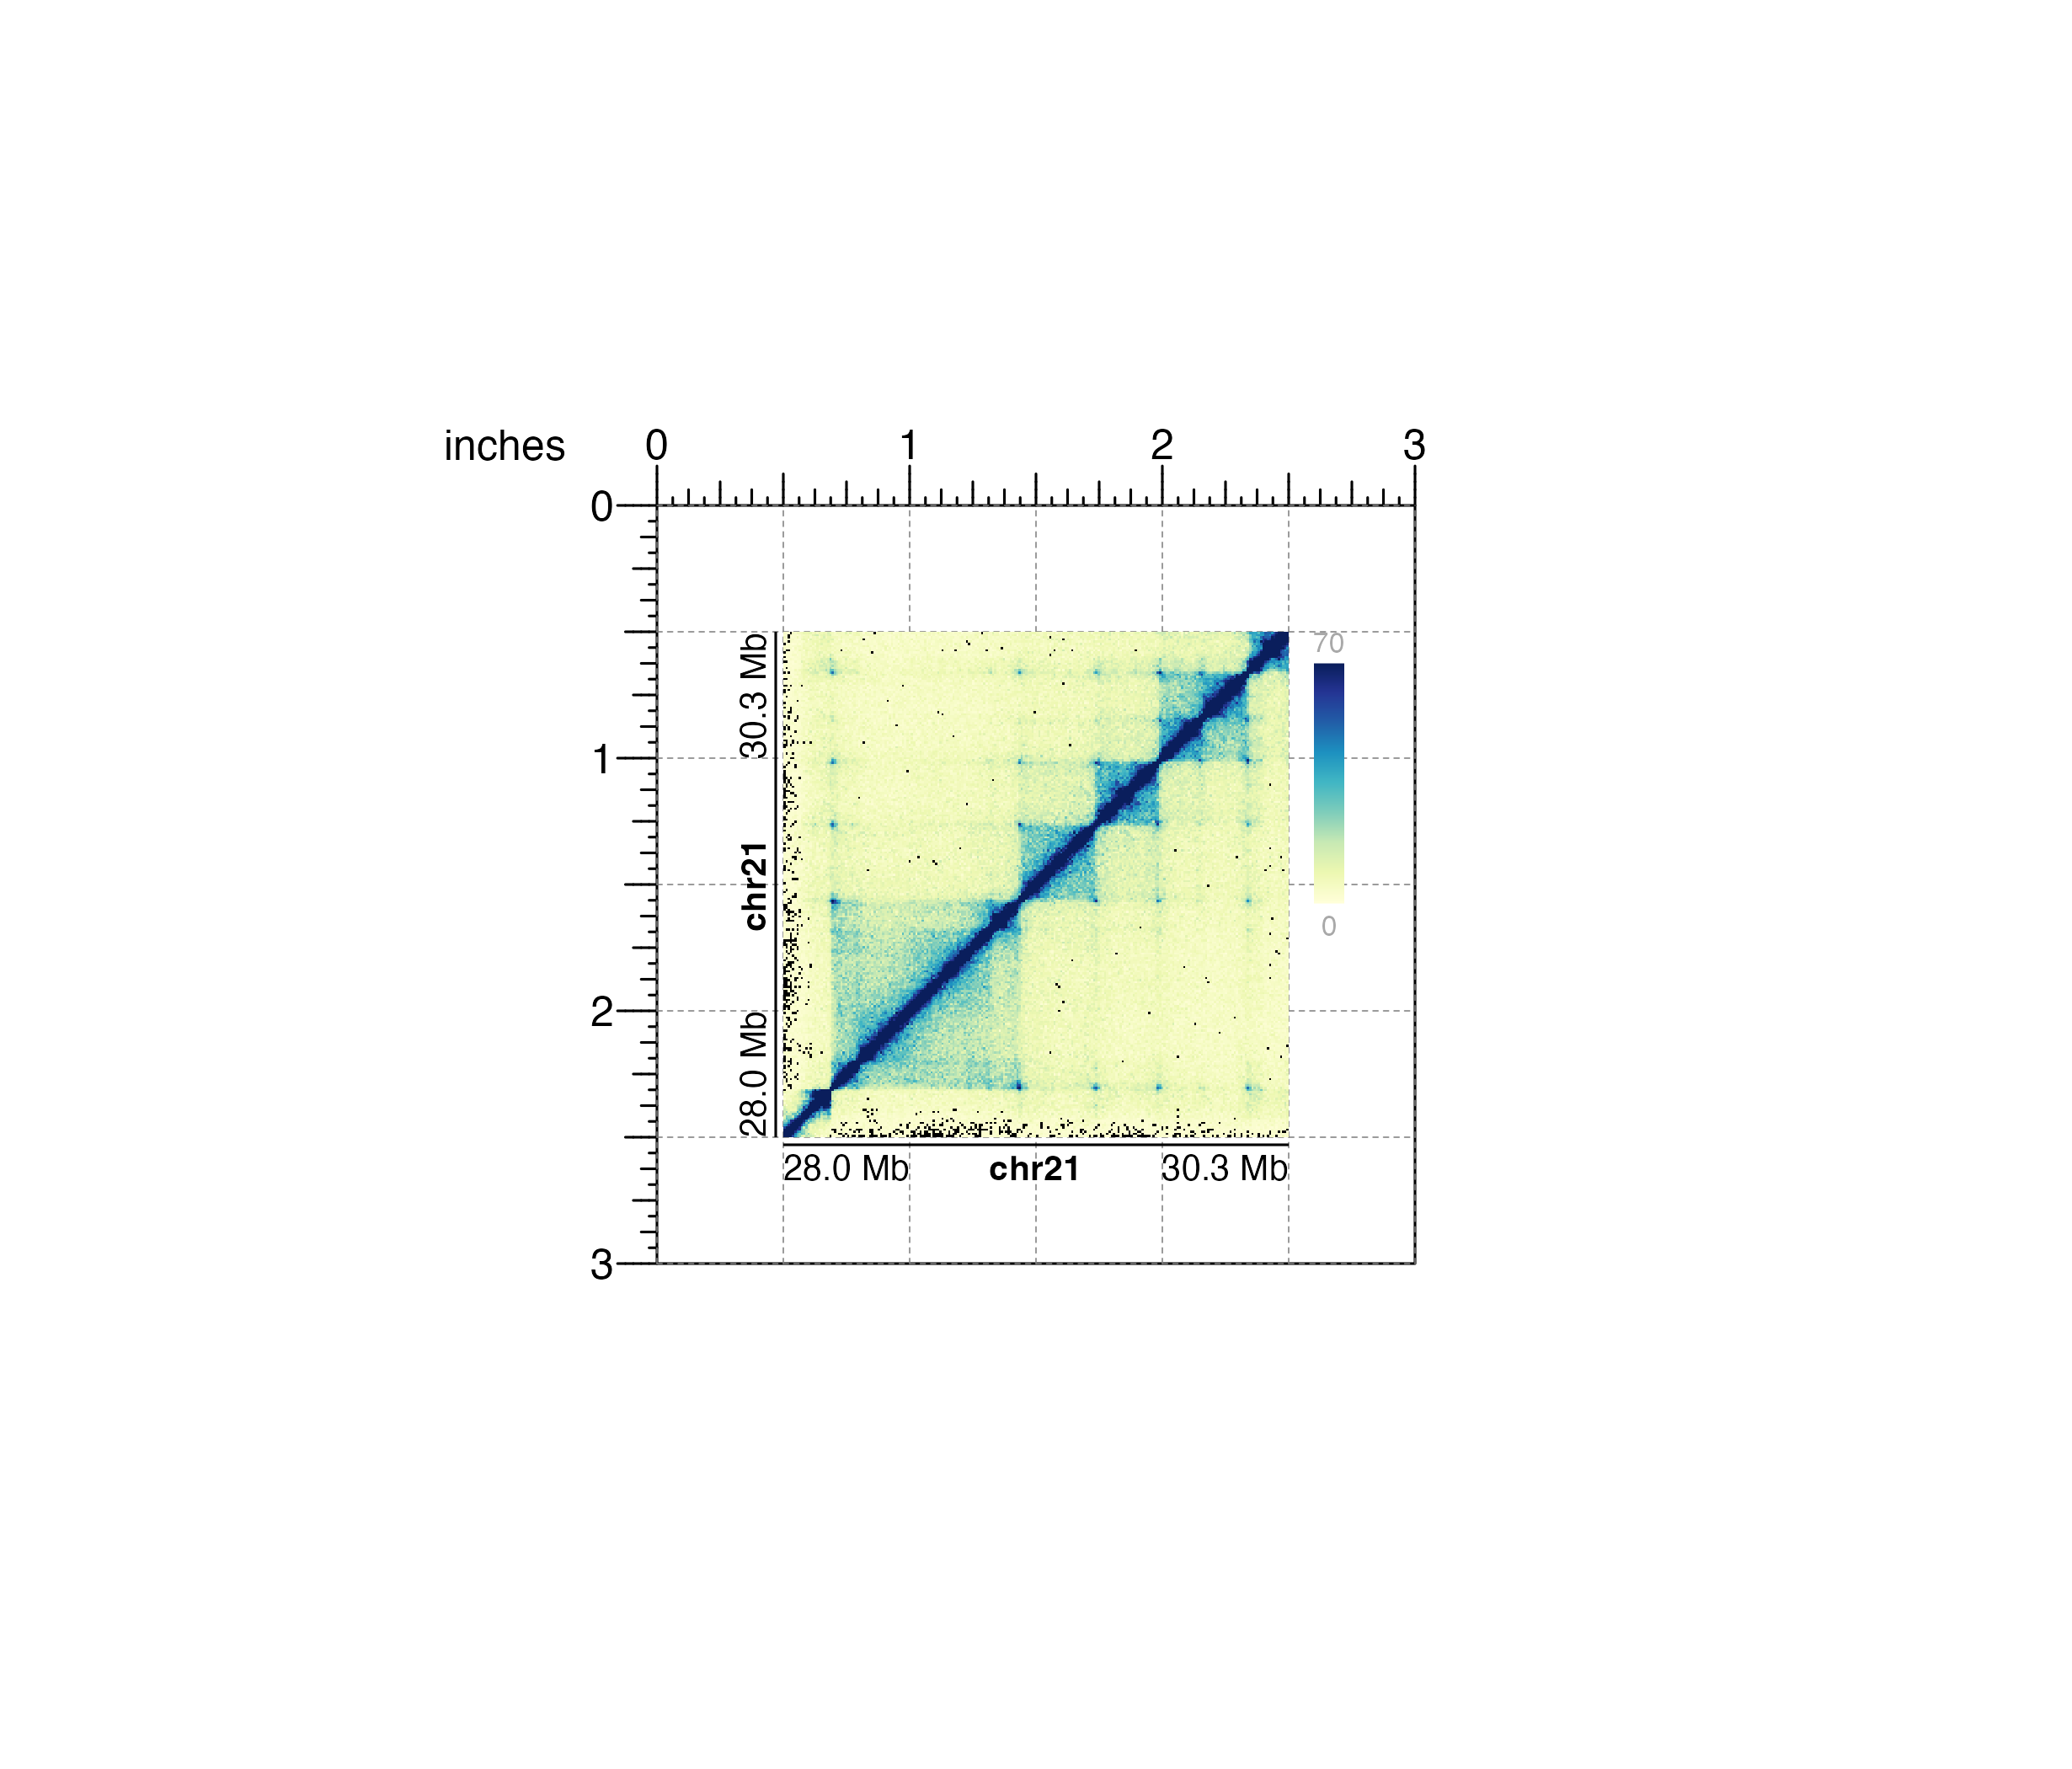
## Create a page
pageCreate(width = 3, height = 3, default.units = "inches")
## Plot and place Hi-C plot
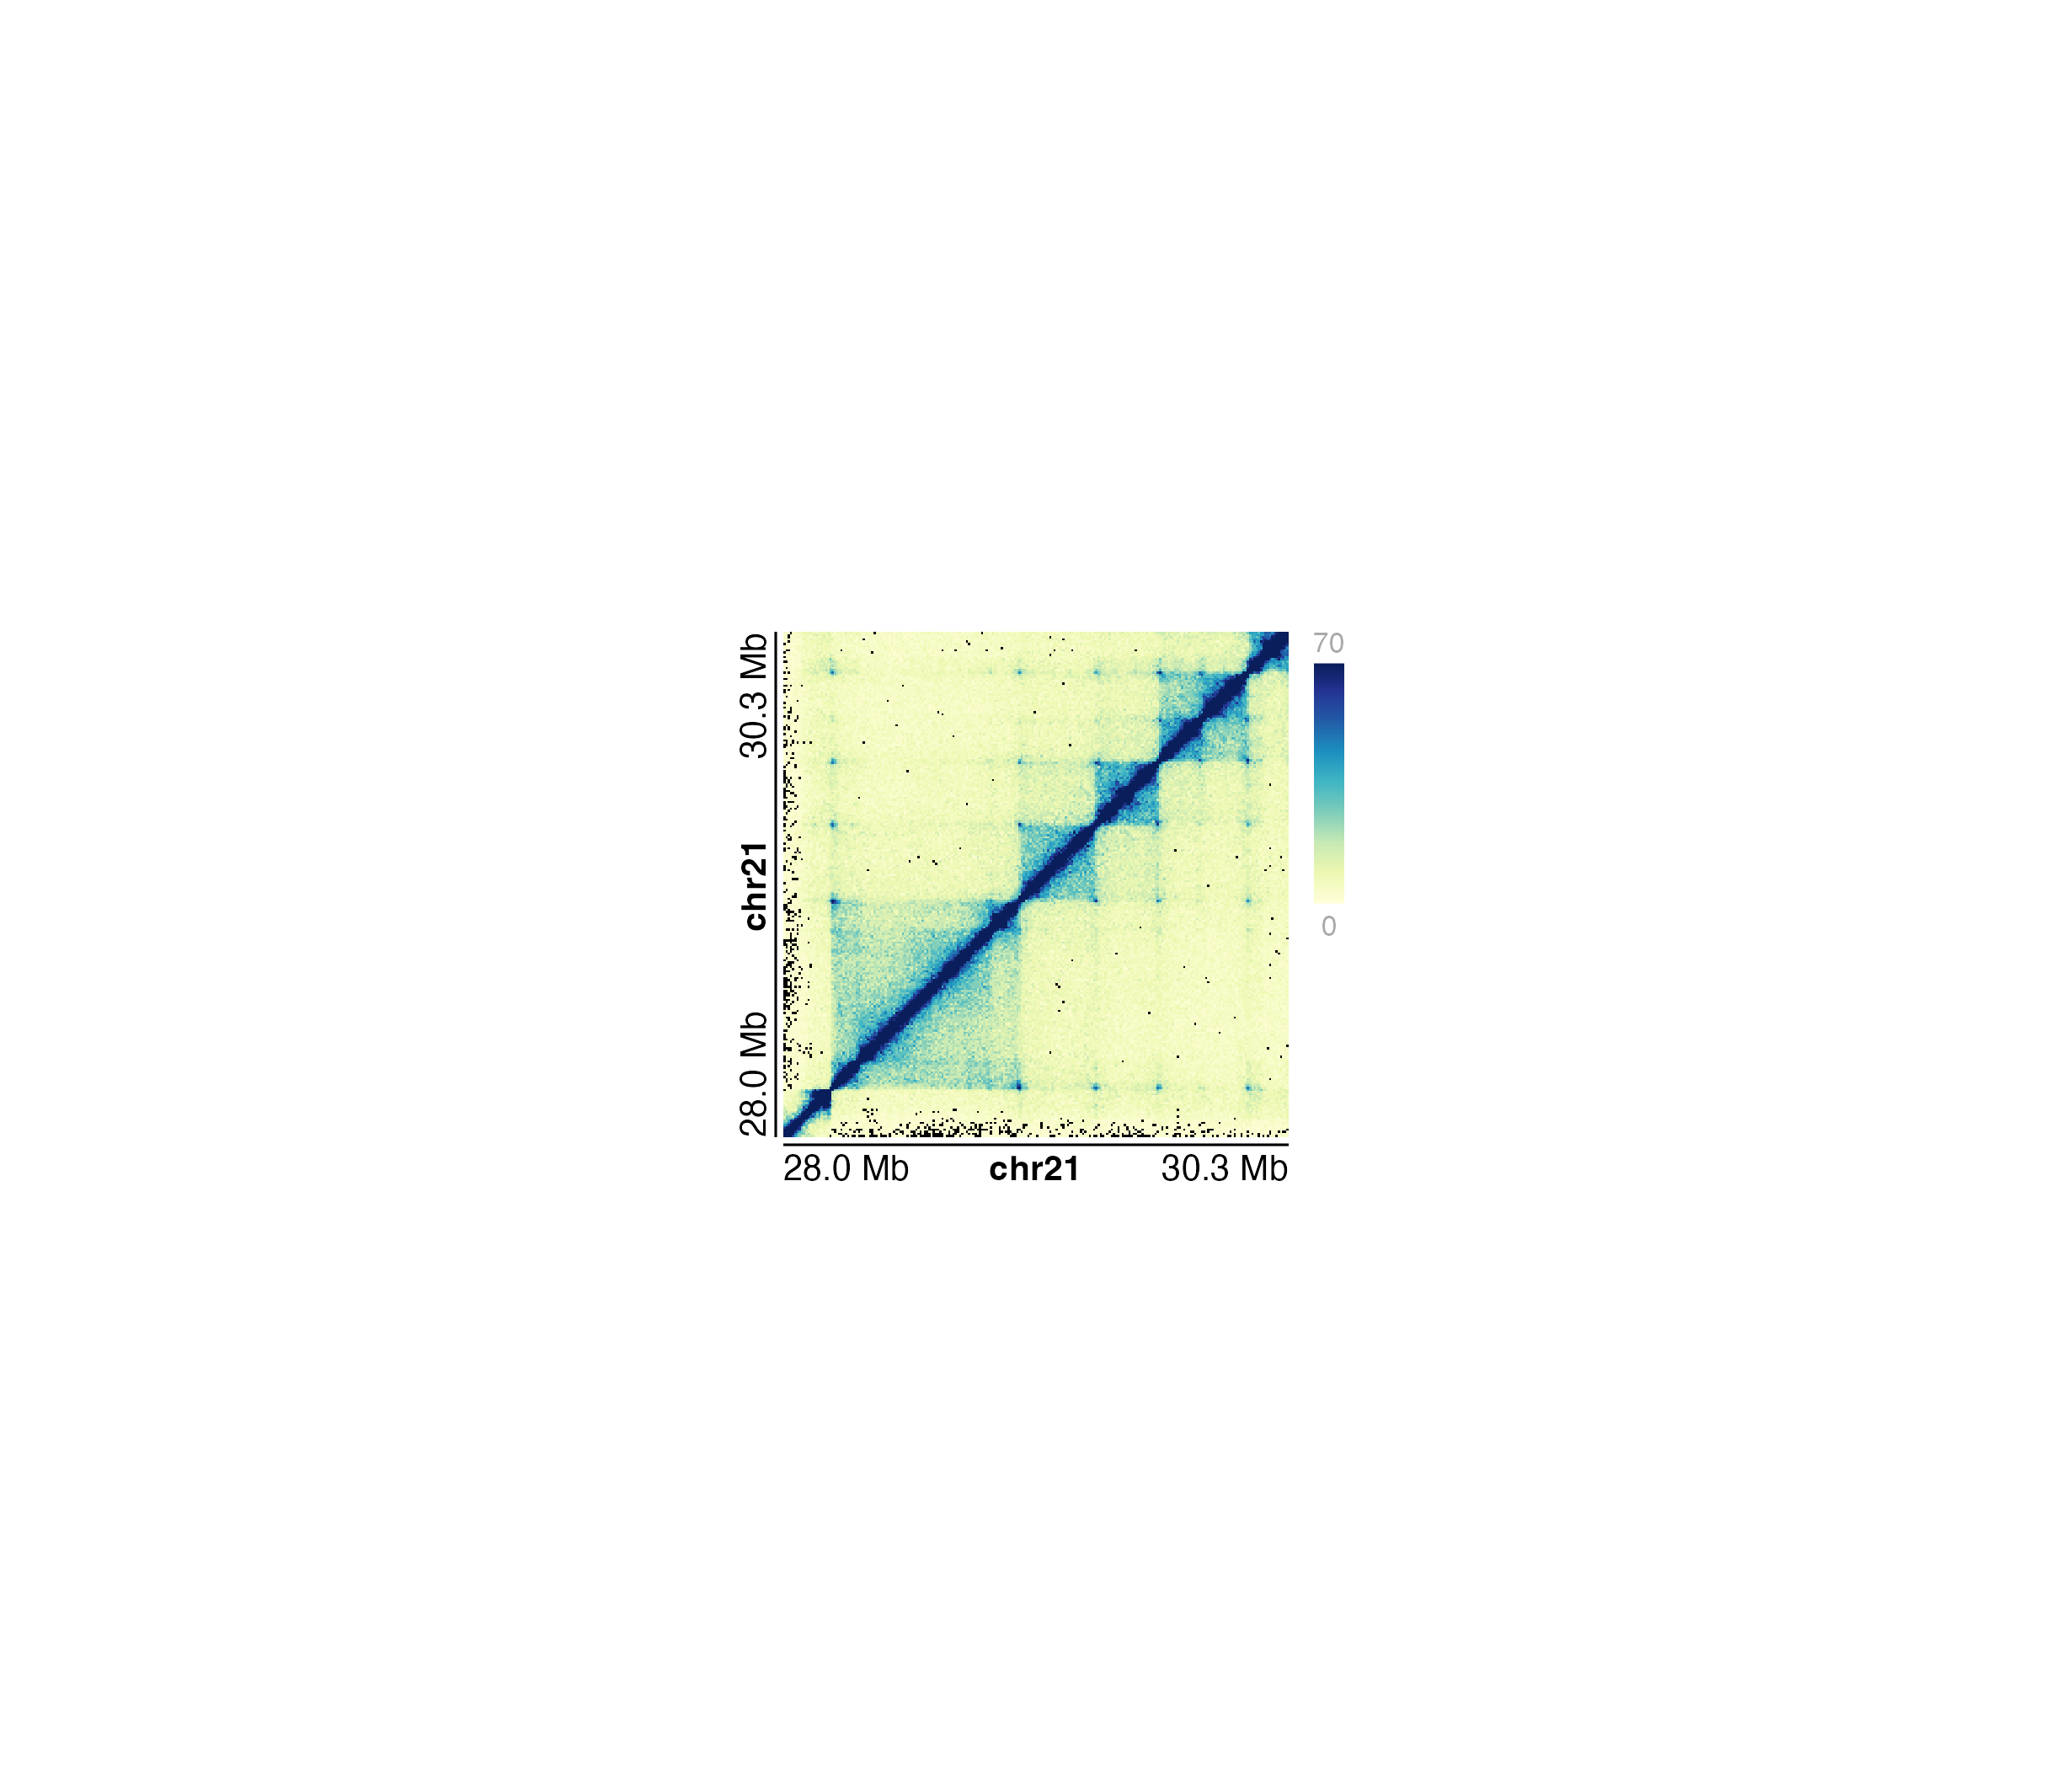
hicPlot <- plotHicSquare(
data = IMR90_HiC_10kb, resolution = 10000,
zrange = c(0, 70),
chrom = "chr21",
chromstart = 28000000, chromend = 30300000,
assembly = "hg19",
x = 0.5, y = 0.5, width = 2, height = 2,
just = c("left", "top"),
default.units = "inches", bg = "black"
)
#> Read in dataframe. Assuming 'chrom' in column1 and 'altchrom' in column2. 10000 BP resolution detected.
#> hicSquare[hicSquare1]
## Annotate heatmap legend
annoHeatmapLegend(
plot = hicPlot, x = 2.6, y = 0.5,
width = 0.12, height = 1.2,
just = c("left", "top"), default.units = "inches"
)
#> heatmapLegend[heatmapLegend1]
## Annotate x-axis and y-axis genome labels
annoGenomeLabel(
plot = hicPlot, scale = "Mb", axis = "x",
x = 0.5, y = 2.53, just = c("left", "top")
)
#> genomeLabel[genomeLabel1]
annoGenomeLabel(
plot = hicPlot, scale = "Mb", axis = "y",
x = 0.47, y = 0.5, just = c("right", "top")
)
 #> genomeLabel[genomeLabel2]
## Hide page guides
pageGuideHide()
#> genomeLabel[genomeLabel2]
## Hide page guides
pageGuideHide()