Annotates a highlight box around a specified genomic region of a plot
Source:R/annoHighlight.R
annoHighlight.RdAnnotates a highlight box around a specified genomic region of a plot
annoHighlight(
    plot,
    chrom,
    chromstart = NULL,
    chromend = NULL,
    fill = "grey",
    linecolor = NA,
    alpha = 0.4,
    y,
    height,
    just = c("left", "top"),
    default.units = "inches",
    params = NULL,
    ...
)
Arguments
- plot
Input plot on which to annotate genomic region.
- chrom
Chromosome of region to be highlighted, as a string.
- chromstart
Integer start position on chromosome to be highlighted.
- chromend
Integer end position on chromosome to be highlighted.
- fill
A character value specifying highlight box fill color. Default value is
fill = "grey".- linecolor
A character value specifying highlight box line color. Default value is
linecolor = NA.- alpha
Numeric value specifying color transparency. Default value is
alpha = 0.4.- y
A numeric, unit object, or character containing a "b" combined with a numeric value specifying square highlight box y-location. The character value will place the highlight box y relative to the bottom of the most recently plotted plot according to the units of the
plotgardenerpage.- height
A numeric or unit object specifying highlight box height.
- just
Justification of highlight box relative to its (x, y) location. If there are two values, the first value specifies horizontal justification and the second value specifies vertical justification. Possible string values are:
"left","right","centre","center","bottom", and"top". Default value isjust = c("left", "top").- default.units
A string indicating the default units to use if
yorheightare only given as numerics or numeric vectors. Default value isdefault.units = "inches".- params
An optional pgParams object containing relevant function parameters.
- ...
Additional grid graphical parameters. See gpar.
Value
Returns a highlight object containing relevant
genomic region, placement, and grob information.
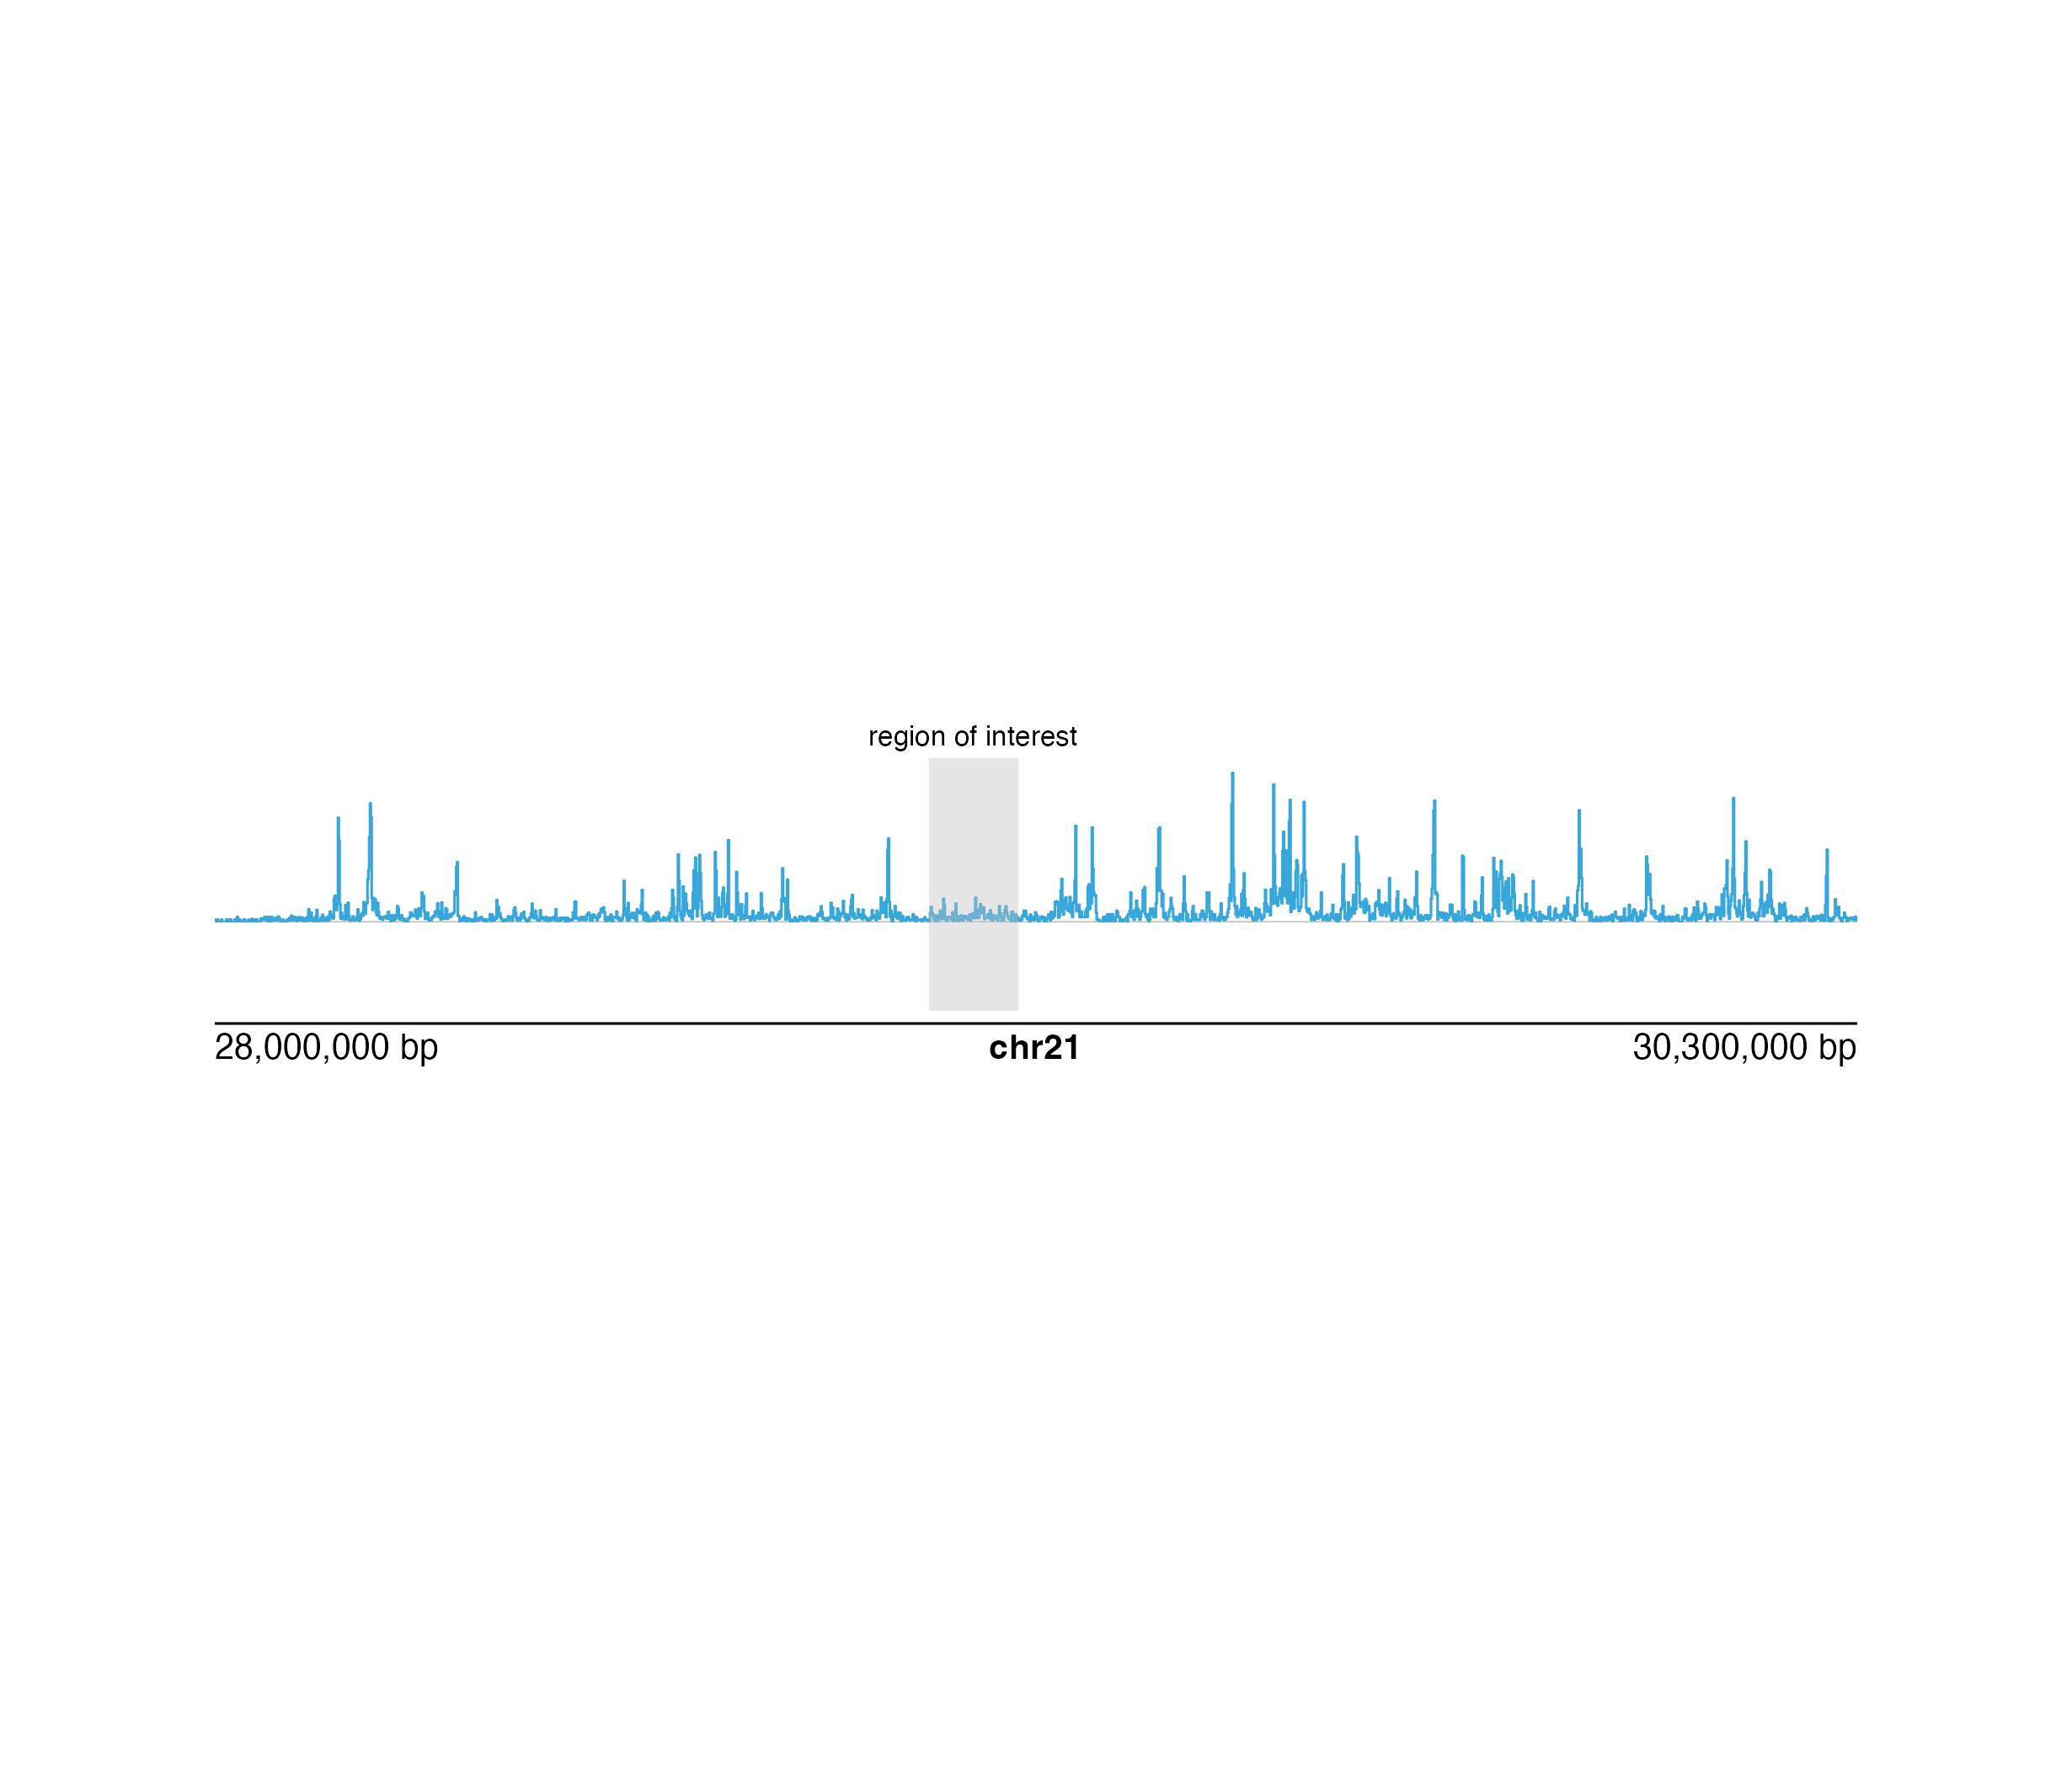
Examples
## Create a page
pageCreate(width = 7.5, height = 1.5, default.units = "inches")
## Plot and place a signal plot
library(plotgardenerData)
data("IMR90_ChIP_H3K27ac_signal")
region <- pgParams(
chrom = "chr21",
chromstart = 28000000, chromend = 30300000,
assembly = "hg19",
range = c(0, 45)
)
signalPlot <- plotSignal(
data = IMR90_ChIP_H3K27ac_signal, params = region,
x = 0.5, y = 0.25, width = 6.5, height = 0.65,
just = c("left", "top"),
default.units = "inches"
)
#> signal[signal1_h]
## Highlight genomic region on signal plot
annoHighlight(
plot = signalPlot,
chrom = "chr21",
chromstart = 29000000, chromend = 29125000,
y = 0.25, height = 1, just = c("left", "top"),
default.units = "inches"
)
#> highlight[highlight1]
## Plot text label
plotText(
label = "region of interest", fontsize = 8, fontcolor = "black",
x = 3.5, y = 0.2, just = "bottom", default.units = "inches"
)
#> text[text1]
## Plot genome label
plotGenomeLabel(
chrom = "chr21",
chromstart = 28000000, chromend = 30300000,
assembly = "hg19",
x = 0.5, y = 1.3, length = 6.5, default.units = "inches"
)
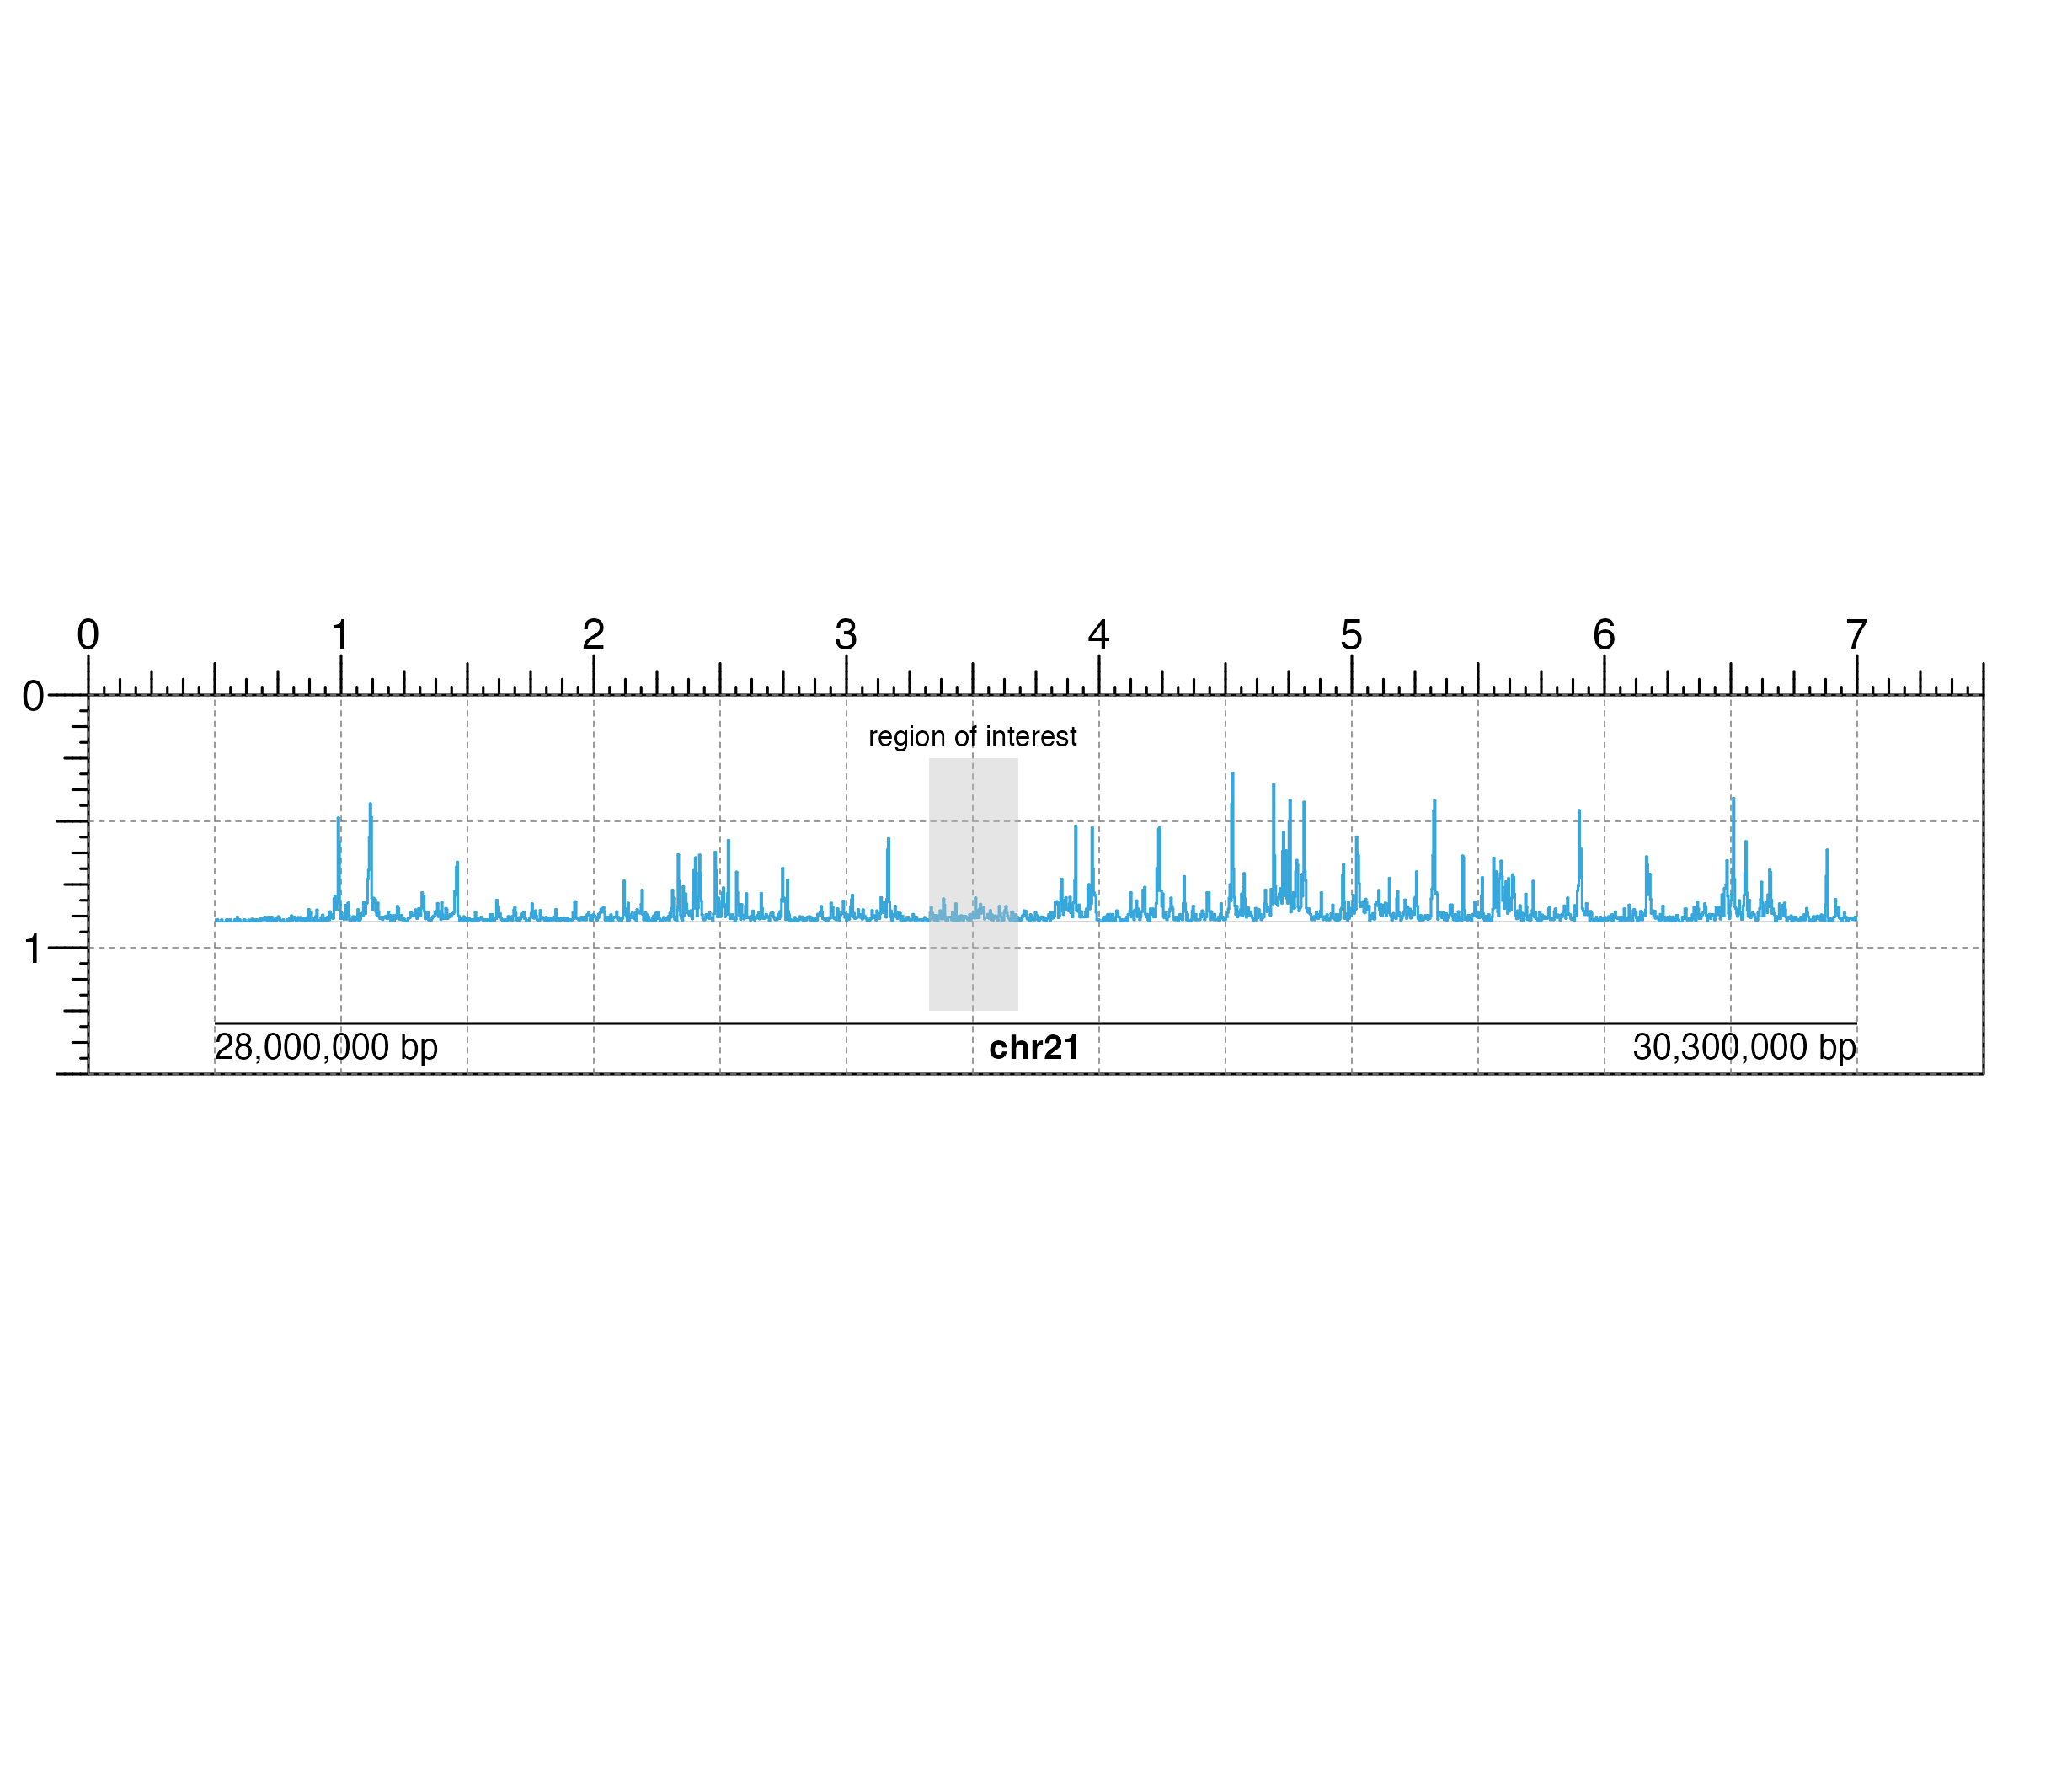 #> genomeLabel[genomeLabel1]
## Hide page guides
pageGuideHide()
#> genomeLabel[genomeLabel1]
## Hide page guides
pageGuideHide()