Plot a Manhattan plot
plotManhattan(
    data,
    sigVal = 5e-08,
    chrom = NULL,
    chromstart = NULL,
    chromend = NULL,
    assembly = "hg38",
    fill = "black",
    pch = 19,
    cex = 0.25,
    leadSNP = NULL,
    sigLine = FALSE,
    sigCol = NULL,
    trans = "-log10",
    range = NULL,
    yscale_reverse = FALSE,
    space = 0.01,
    bg = NA,
    baseline = FALSE,
    baseline.color = "grey",
    baseline.lwd = 1,
    x = NULL,
    y = NULL,
    width = NULL,
    height = NULL,
    just = c("left", "top"),
    flip = FALSE,
    default.units = "inches",
    draw = TRUE,
    params = NULL,
    ...
)
Arguments
- data
Data to be plotted, as a character value specifying a file path of GWAS data, a dataframe, or a GRanges object. Each of these data types must have the following columns:
"chrom":Chromosome names. This column must be a character.
"pos":Chromosomal position. This column must be an integer or numeric.
"p":p-value or similar measure. This column must be numeric. Values will be converted according to the
transparameter."snp"(optional):SNP name or rsid. This column should be a character.
- sigVal
A numeric specifying the significance level of p-values. Along with data p-values, this value will be converted according to the
transparameter. Default value issigVal = 5e-08.- chrom
Chromosome of region to be plotted, as a string. If left
NULL, all chromosomes found in data will be plotted.- chromstart
Integer start position on chromosome to be plotted.
- chromend
Integer end position on chromosome to be plotted.
- assembly
Default genome assembly as a string or a assembly object. Default value is
assembly = "hg38".- fill
A single character value, a vector, or a colorby object specifying fill colors of data points. For a Manhattan plot with multiple chromosomes, a vector of colors will be used to color points of different chromosomes. Default value is
fill = "black".- pch
A numeric value or numeric vector specifying point symbols. If colorby object is supplied for
fill, point symbols will be mapped tocolorbyvalues. Default value ispch = 19.- cex
A numeric indicating the amount by which points should be scaled relative to the default. Default value is
cex = 0.25.- leadSNP
A list specifying the lead SNP in the desired region and any associated aesthetic features of the lead SNP data point and text label. The lead SNP should be specified as a character with the name slot
"snp"in the list. Accepted lead SNP aesthetic features in the list includefill,pch,cex,fontcolor, andfontsize.- sigLine
Logical value indicating whether to draw a line at the significance level indicated with
sigVal. Default value issigLine = FALSE.- sigCol
Single character value specifying the color of significant data points.
- trans
Character value specifying the transformation to apply to the "p" column plotted along the y-axis. For no transformation, set value to the empty character "". Default value is
trans = "-log10".- range
A numeric vector of length 2 specifying the y-range of p-values to plot (c(min, max)).
- yscale_reverse
Logical value indicating whether to reverse the y-scale and order points from max to min.
- space
A numeric value indicating the space between each chromosome as a fraction of the width of the plot, if plotting multiple chromosomes. Default value is
space = 0.01.- bg
Character value indicating background color. Default value is
bg = NA.- baseline
Logical value indicating whether to include a baseline along the x-axis. Default value is
baseline = FALSE.- baseline.color
Baseline color. Default value is
baseline.color = "grey".- baseline.lwd
Baseline line width. Default value is
baseline.lwd = 1.- x
A numeric or unit object specifying Manhattan plot x-location.
- y
A numeric, unit object, or character containing a "b" combined with a numeric value specifying Manhattan plot y-location. The character value will place the Manhattan plot y relative to the bottom of the most recently plotted plot according to the units of the plotgardener page.
- width
A numeric or unit object specifying Manhattan plot width.
- height
A numeric or unit object specifying Manhattan plot height.
- just
Justification of Manhattan plot relative to its (x, y) location. If there are two values, the first value specifies horizontal justification and the second value specifies vertical justification. Possible string values are:
"left","right","centre","center","bottom", and"top". Default value isjust = c("left", "top").- flip
Logical value indicating whether to reflect Manhattan plot over the x-axis. Default value is
flip = FALSE.- default.units
A string indicating the default units to use if
x,y,width, orheightare only given as numerics. Default value isdefault.units = "inches".- draw
A logical value indicating whether graphics output should be produced. Default value is
draw = TRUE.- params
An optional pgParams object containing relevant function parameters.
- ...
Additional grid graphical parameters. See gpar.
Value
Returns a manhattan object containing
relevant genomic region, placement, and grob information.
Details
A Manhattan plot can be placed on a plotgardener coordinate page by providing plot placement parameters:
plotManhattan(data,
                chrom = NULL,
                chromstart = NULL, chromend = NULL,
                x, y, width, height, just = c("left", "top"),
                default.units = "inches")
This function can also be used to quickly plot an unannotated Manhattan plot by ignoring plot placement parameters:
plotManhattan(data,
                chrom = NULL,
                chromstart = NULL, chromend = NULL)
Examples
## Load genomic assembly information
library("TxDb.Hsapiens.UCSC.hg19.knownGene")
## Load GWAS data
library(plotgardenerData)
data("hg19_insulin_GWAS")
## Create a page
pageCreate(width = 7.5, height = 4.5, default.units = "inches")
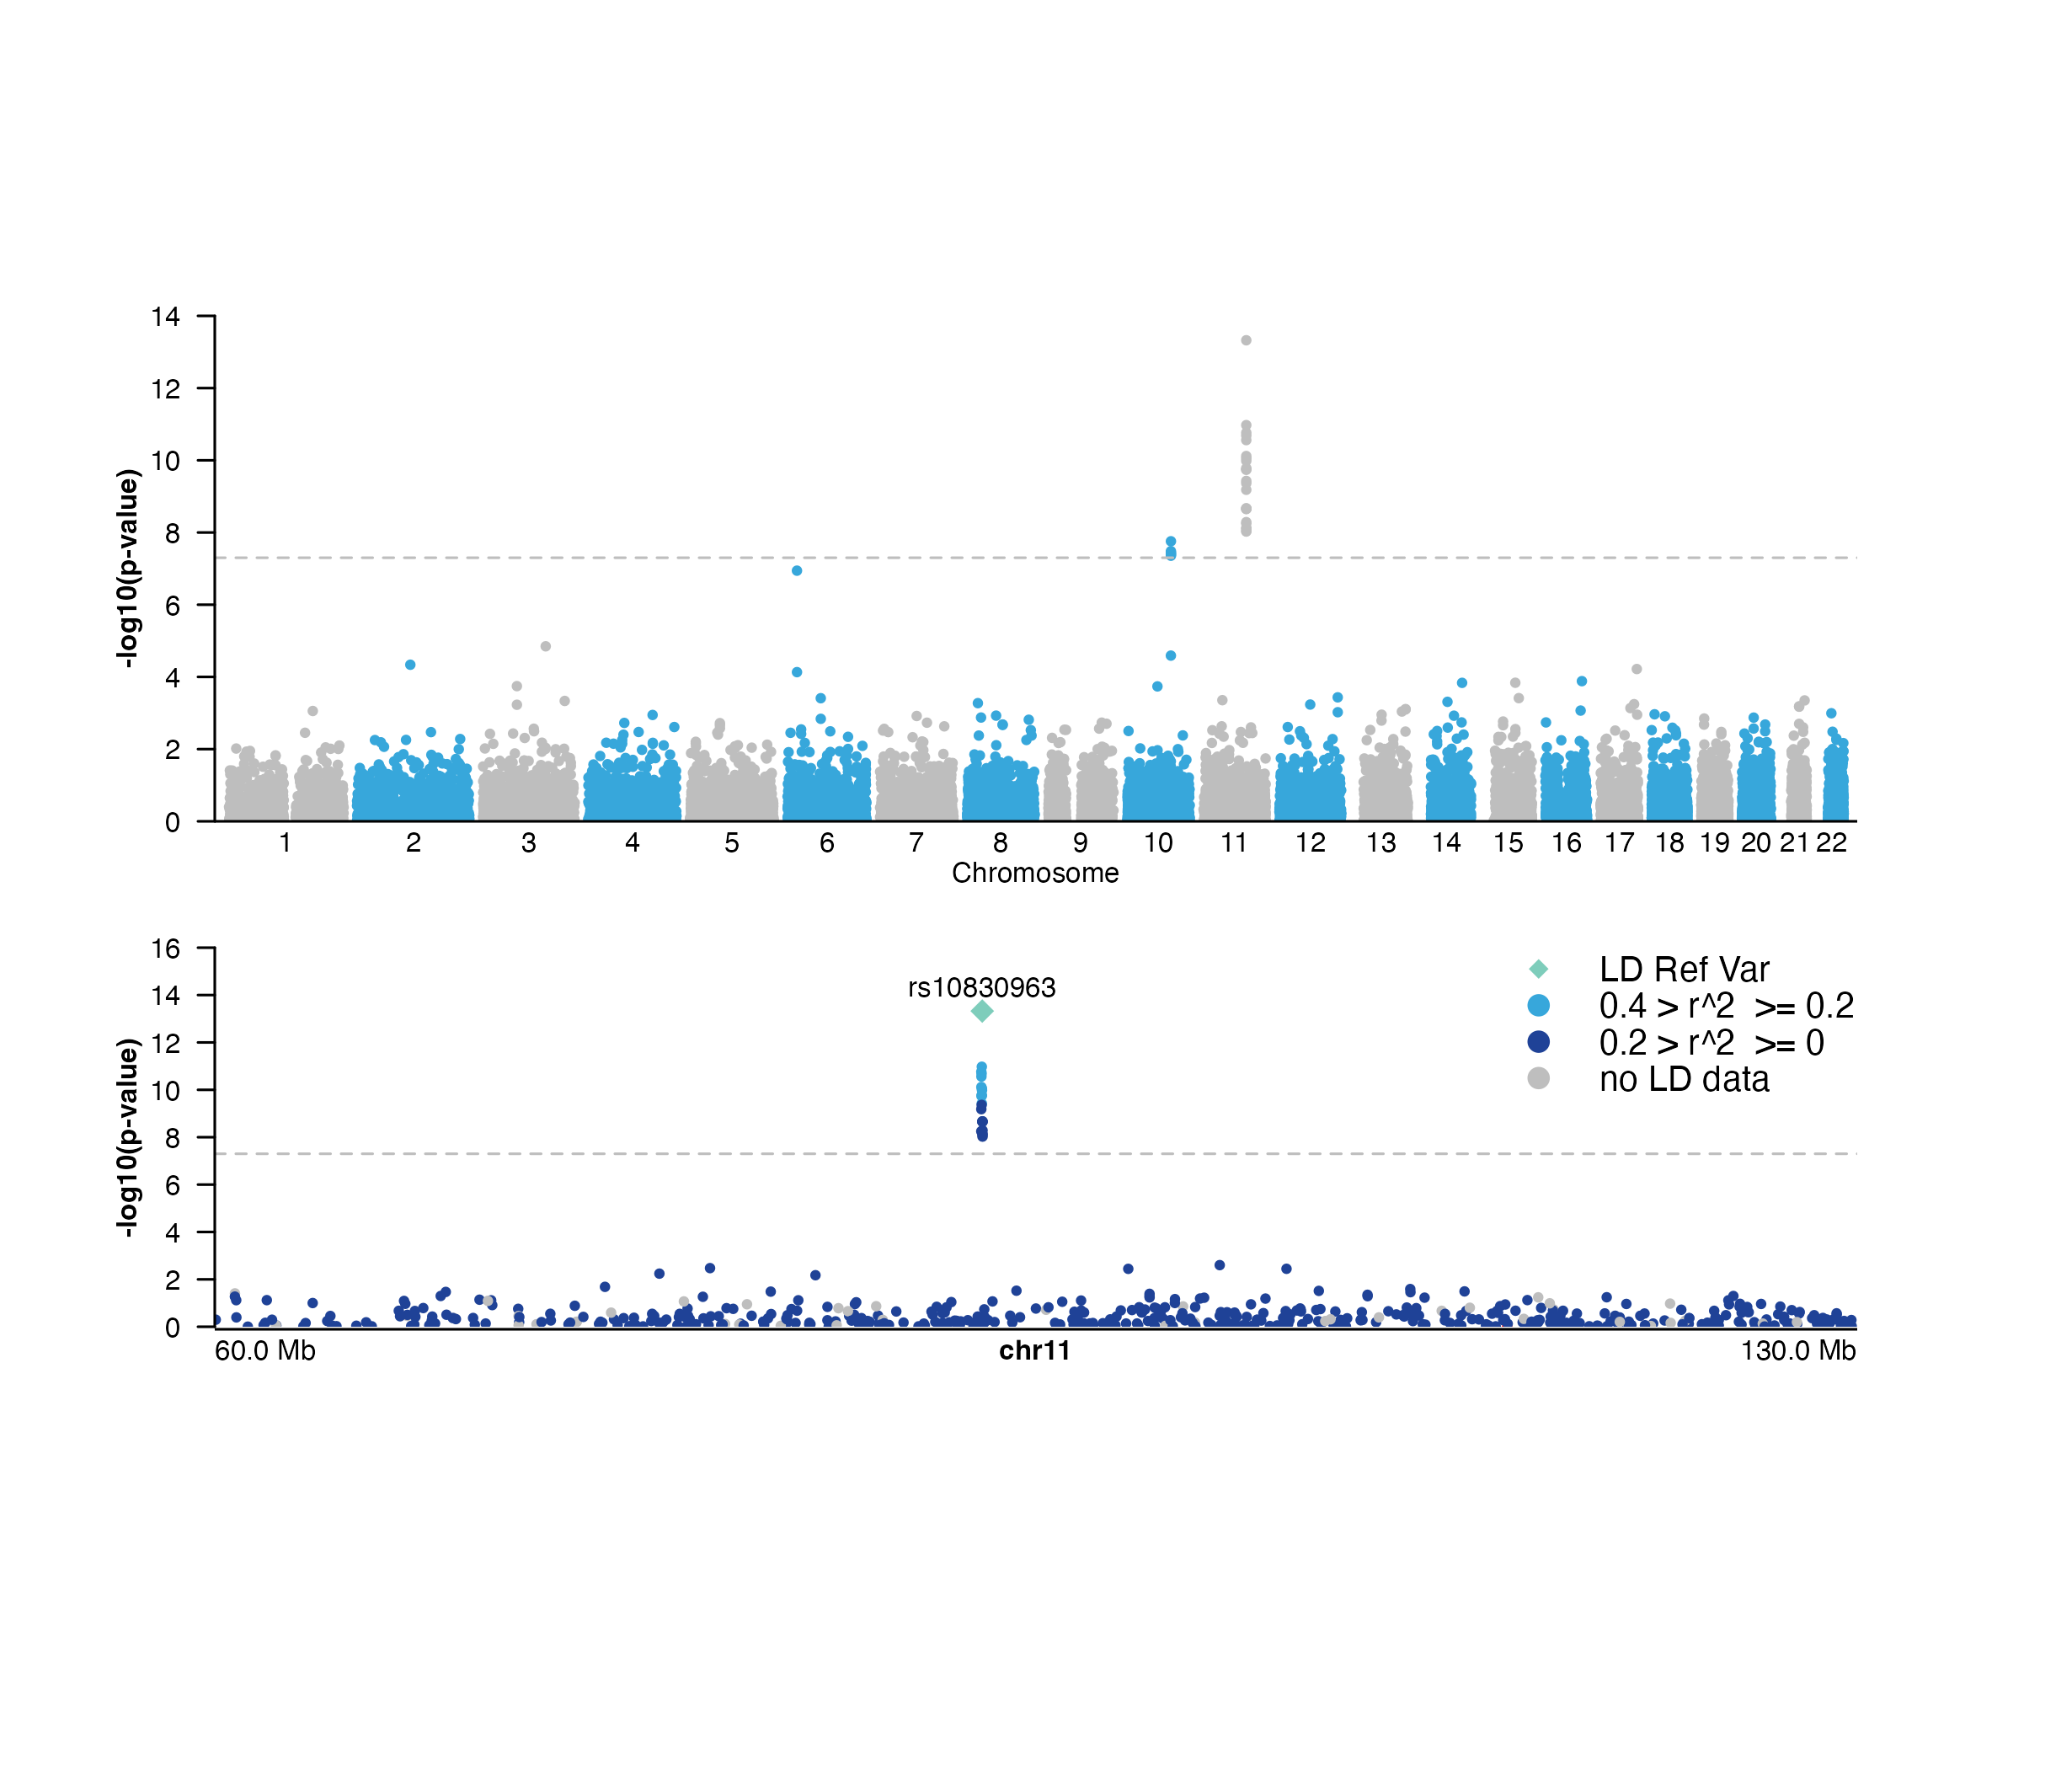
## Plot all GWAS data
manhattanPlot <- plotManhattan(
data = hg19_insulin_GWAS, assembly = "hg19",
fill = c("grey", "#37a7db"),
sigLine = TRUE,
trans = "-log10",
col = "grey", lty = 2, range = c(0, 14),
x = 0.5, y = 0, width = 6.5, height = 2,
just = c("left", "top"),
default.units = "inches"
)
#> manhattan[manhattan1]
## Annotate genome label
annoGenomeLabel(
plot = manhattanPlot, x = 0.5, y = 2, fontsize = 8,
just = c("left", "top"),
default.units = "inches"
)
#> genomeLabel[genomeLabel1]
plotText(
label = "Chromosome", fontsize = 8,
x = 3.75, y = 2.20, just = "center", default.units = "inches"
)
#> text[text1]
## Annotate y-axis
annoYaxis(
plot = manhattanPlot, at = c(0, 2, 4, 6, 8, 10, 12, 14),
axisLine = TRUE, fontsize = 8
)
#> yaxis[yaxis1]
## Plot y-axis label
plotText(
label = "-log10(p-value)", x = 0.15, y = 1, rot = 90,
fontsize = 8, fontface = "bold", just = "center",
default.units = "inches"
)
#> text[text2]
## Plot GWAS data zooming in on chromosome 11
## highlighting a lead SNP, and coloring by LD score
hg19_insulin_GWAS$LD <- as.numeric(hg19_insulin_GWAS$LD)
## Group LD column into LD ranges
hg19_insulin_GWAS <- as.data.frame(dplyr::group_by(hg19_insulin_GWAS,
LDgrp = cut(
hg19_insulin_GWAS$LD,
c(0, 0.2, 0.4, 0.6, 0.8, 1))))
hg19_insulin_GWAS$LDgrp <- addNA(hg19_insulin_GWAS$LDgrp)
leadSNP_p <- min(hg19_insulin_GWAS[
which(hg19_insulin_GWAS$chrom == "chr11"), ]$p)
leadSNP <- hg19_insulin_GWAS[which(hg19_insulin_GWAS$p == leadSNP_p), ]$snp
chr11_manhattanPlot <- plotManhattan(
data = hg19_insulin_GWAS, chrom = "chr11",
chromstart = 60000000,
chromend = 130000000,
assembly = "hg19",
fill = colorby("LDgrp",
palette = colorRampPalette(c(
"#1f4297",
"#37a7db", "green",
"orange", "red", "grey"
))),
trans = "-log10",
sigLine = TRUE, col = "grey",
lty = 2, range = c(0, 16),
leadSNP = list(
snp = leadSNP,
pch = 18,
cex = 0.75,
fill = "#7ecdbb",
fontsize = 8
),
x = 0.5, y = 2.5, width = 6.5,
height = 1.5,
just = c("left", "top"),
default.units = "inches"
)
#> manhattan[manhattan2]
## Plot legend for LD scores
plotLegend(
legend = c(
"LD Ref Var",
paste("0.4", ">", "r^2",
"", ">=", "0.2"),
paste("0.2", ">", "r^2",
"", ">=", "0"),
"no LD data"
),
fill = c("#7ecdbb", "#37a7db", "#1f4297", "grey"), cex = 0.75,
pch = c(18, 19, 19, 19), border = FALSE, x = 7, y = 2.5,
width = 1.5, height = 0.6, just = c("right", "top"),
default.units = "inches"
)
#> legend[legend1]
## Annotate genome label
annoGenomeLabel(
plot = chr11_manhattanPlot, x = 0.5, y = 4.01,
fontsize = 8, scale = "Mb",
just = c("left", "top"), default.units = "inches"
)
#> genomeLabel[genomeLabel2]
## Annotate y-axis
annoYaxis(
plot = chr11_manhattanPlot,
at = c(0, 2, 4, 6, 8, 10, 12, 14, 16),
axisLine = TRUE, fontsize = 8
)
#> yaxis[yaxis2]
## Plot y-axis label
plotText(
label = "-log10(p-value)", x = 0.15, y = 3.25, rot = 90,
fontsize = 8, fontface = "bold", just = "center",
default.units = "inches"
)
 #> text[text2]
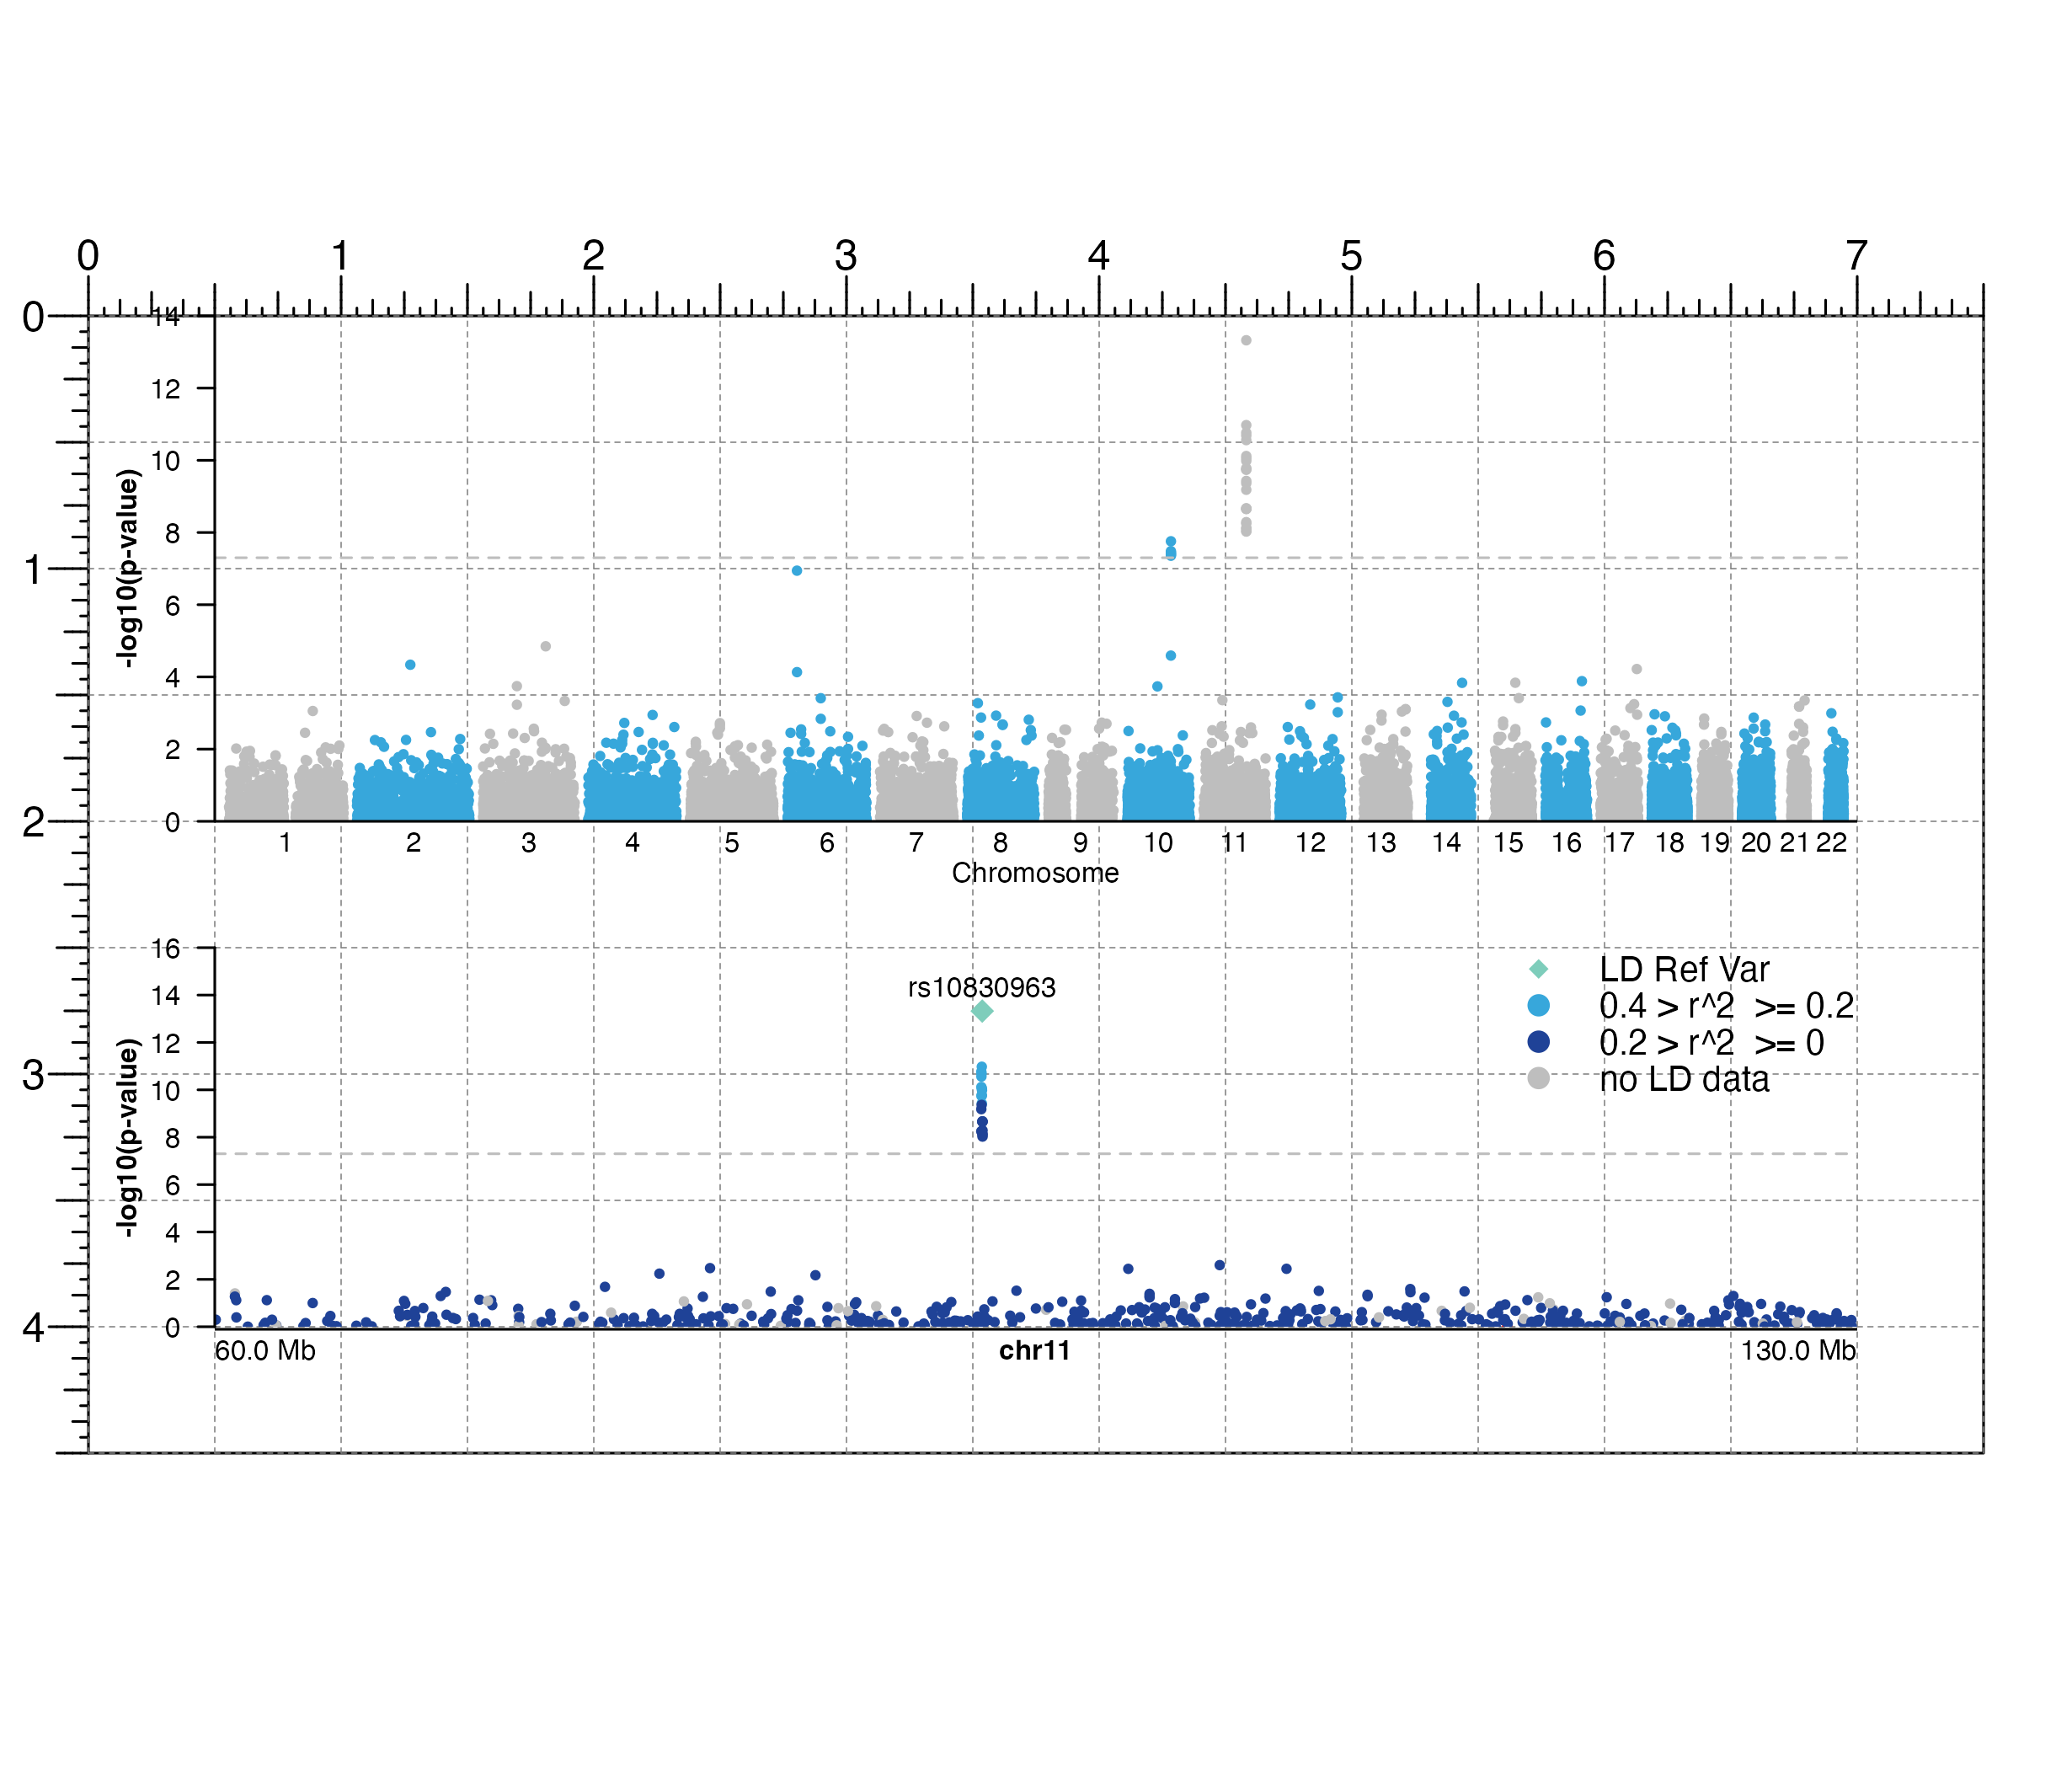
## Hide page guides
pageGuideHide()
#> text[text2]
## Hide page guides
pageGuideHide()