Plot a legend
plotLegend(
    legend,
    fill = NULL,
    pch = NULL,
    lty = NULL,
    orientation = "v",
    title = NULL,
    fontsize = 10,
    border = TRUE,
    bg = NA,
    x = NULL,
    y = NULL,
    width = NULL,
    height = NULL,
    just = c("left", "top"),
    default.units = "inches",
    draw = TRUE,
    params = NULL,
    ...
)
Arguments
- legend
A character or expression vector to appear in the legend.
- fill
If specified, this argument will produce boxes filled with the specified colors to appear beside the legend text.
- pch
The plotting symbols appearing in the legend, as a numeric vector.
- lty
The line types for lines appearing in the legend.
- orientation
A string specifying legend orientation. Default value is
orientation = "v". Options are:"v":Vertical legend orientation.
"h":Horizontal legend orientation.
- title
A character value giving a title to be placed at the top of the legend.
- fontsize
A numeric specifying text fontsize in points. Default value is
fontsize = 10.- border
Logical value indicating whether to add a border around heatmap legend. Default value is
border = TRUE.- bg
Character value indicating background color. Default value is
bg = NA.- x
A numeric or unit object specifying legend x-location.
- y
A numeric, unit object, or character containing a "b" combined with a numeric value specifying legend y-location. The character value will place the legend y relative to the bottom of the most recently plotted plot according to the units of the plotgardener page.
- width
A numeric or unit object specifying legend width.
- height
A numeric or unit object specifying legend height.
- just
Justification of legend relative to its (x, y) location. If there are two values, the first value specifies horizontal justification and the second value specifies vertical justification. Possible string values are:
"left","right","centre","center","bottom", and"top". Default value isjust = c("left", "top").- default.units
A string indicating the default units to use if
x,y,width, orheightare only given as numerics. Default value isdefault.units = "inches".- draw
A logical value indicating whether graphics output should be produced. Default value is
draw = TRUE.- params
An optional pgParams object containing relevant function parameters.
- ...
Additional grid graphical parameters. See gpar.
Value
Returns a legend object containing relevant
placement and grob information.
Examples
## Load BED data
library(plotgardenerData)
data("IMR90_ChIP_CTCF_reads")
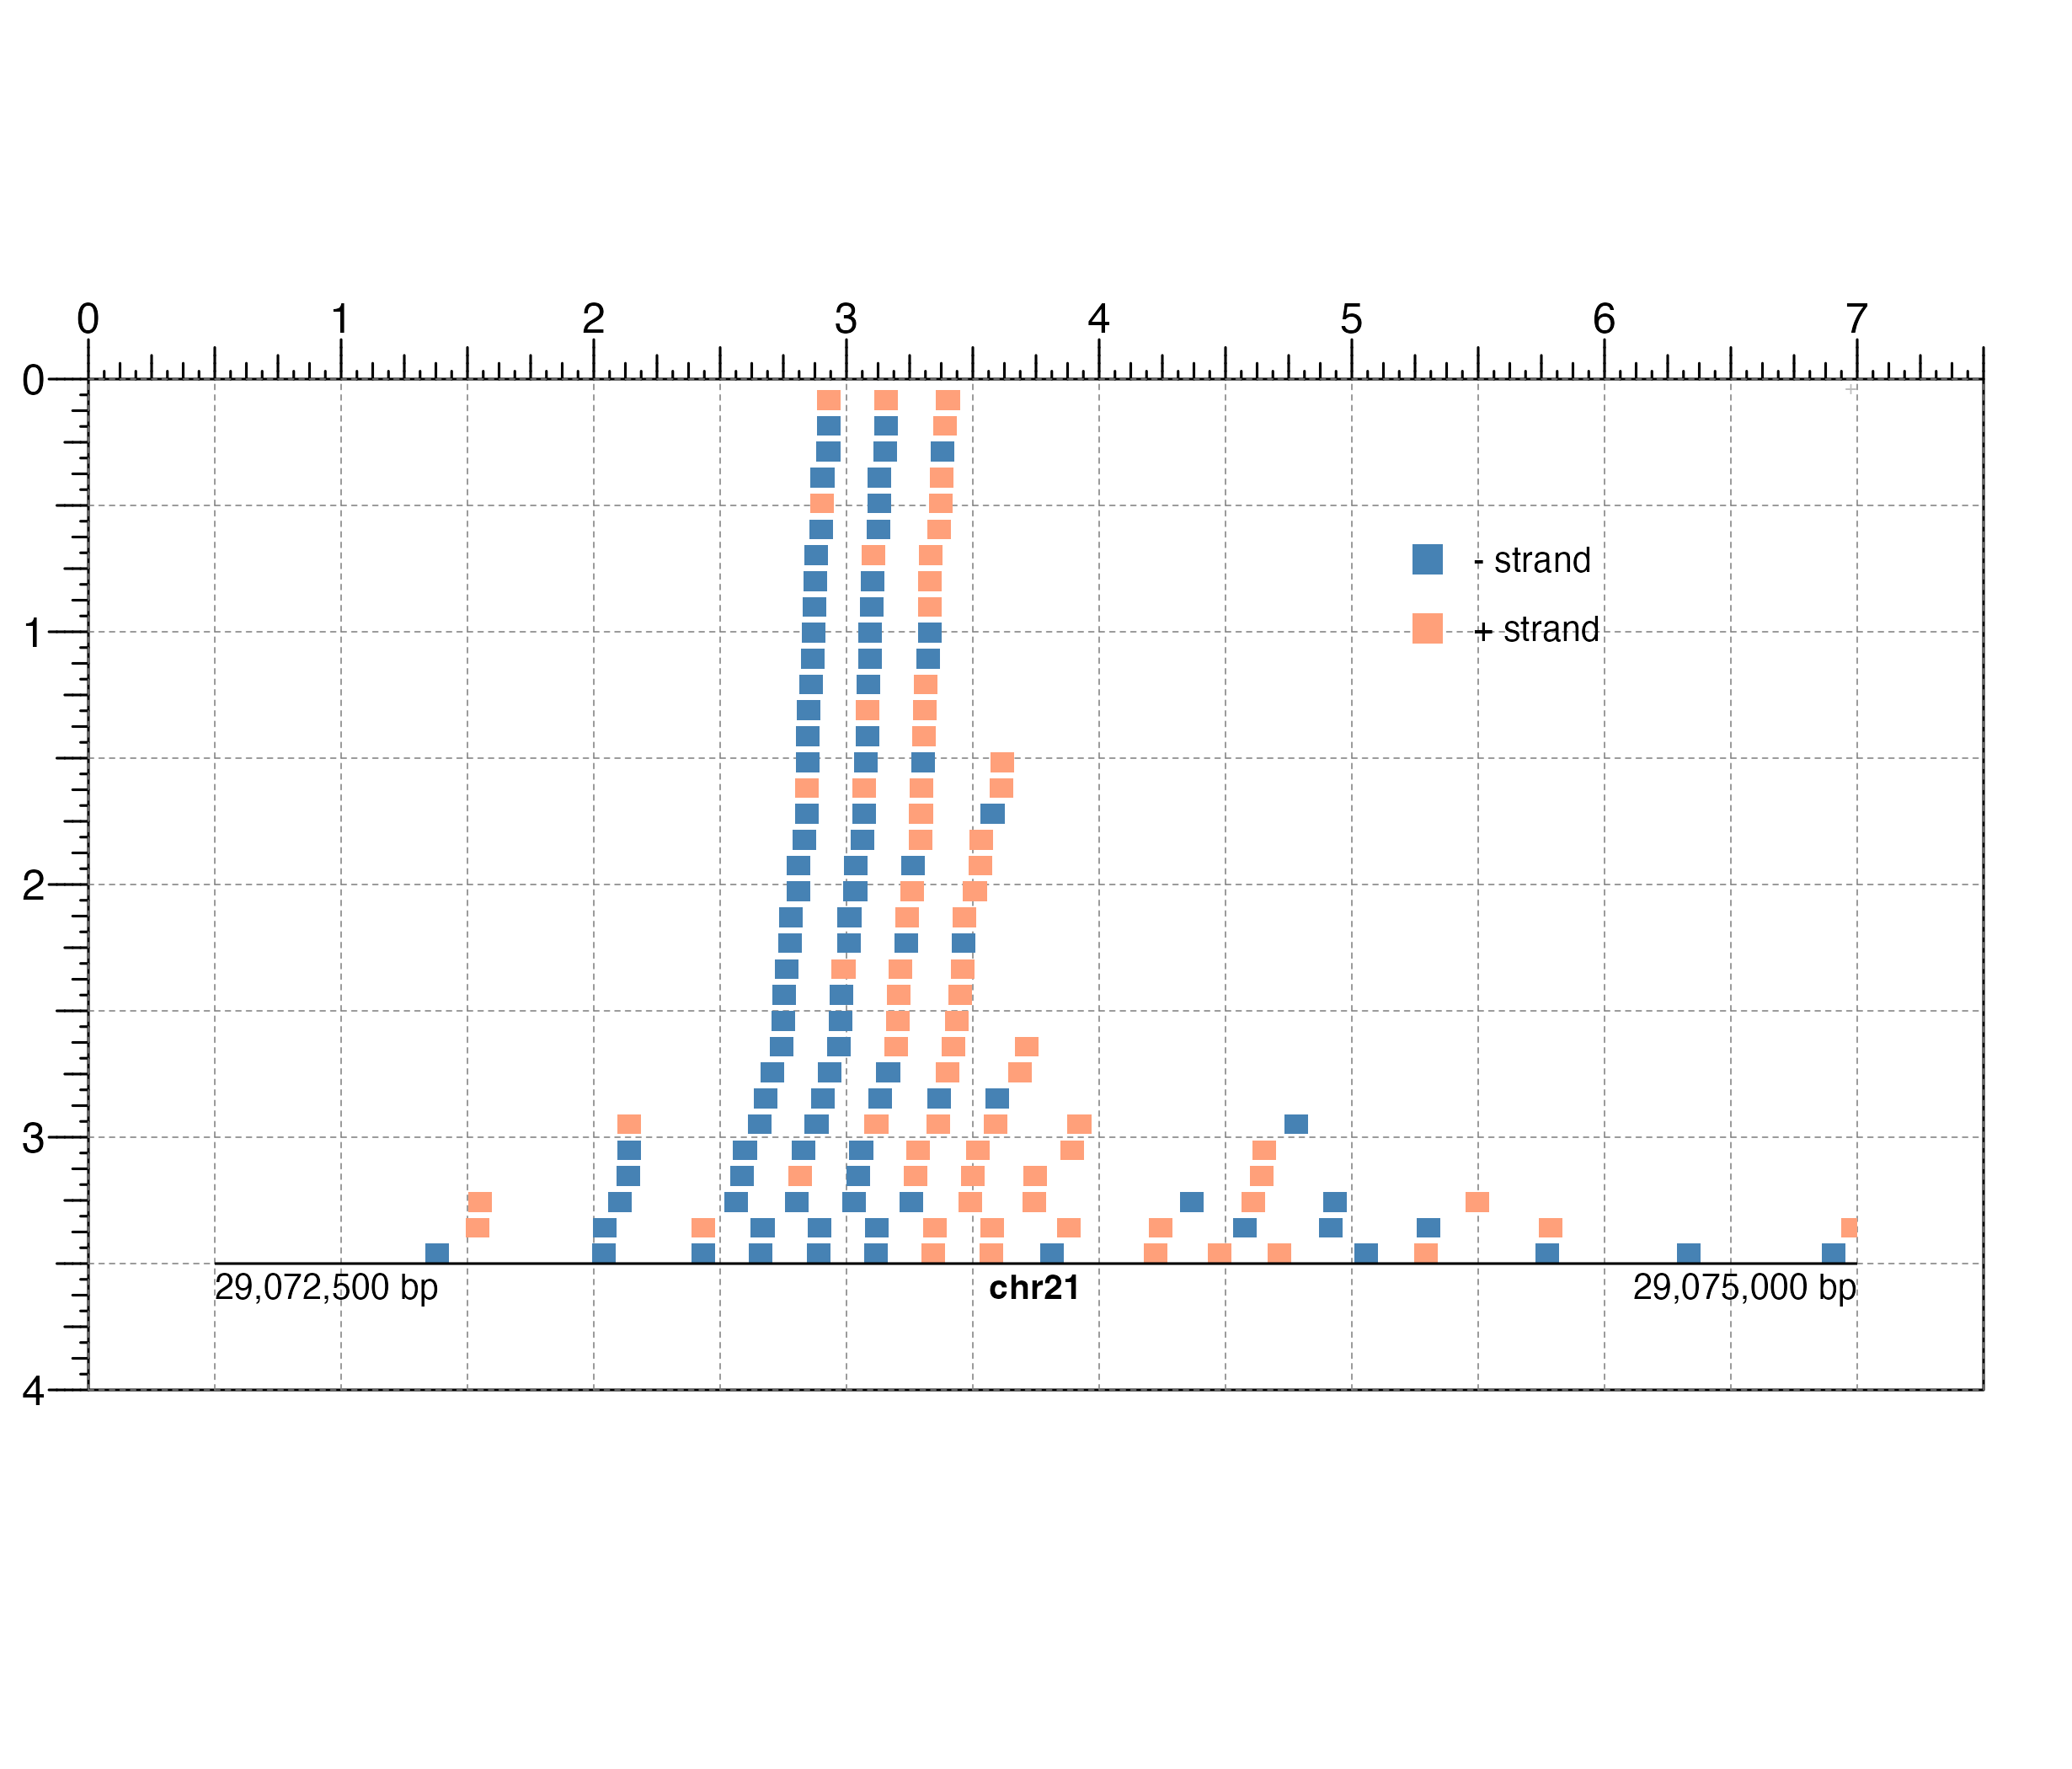
## Create page
pageCreate(width = 7.5, height = 4, default.units = "inches")
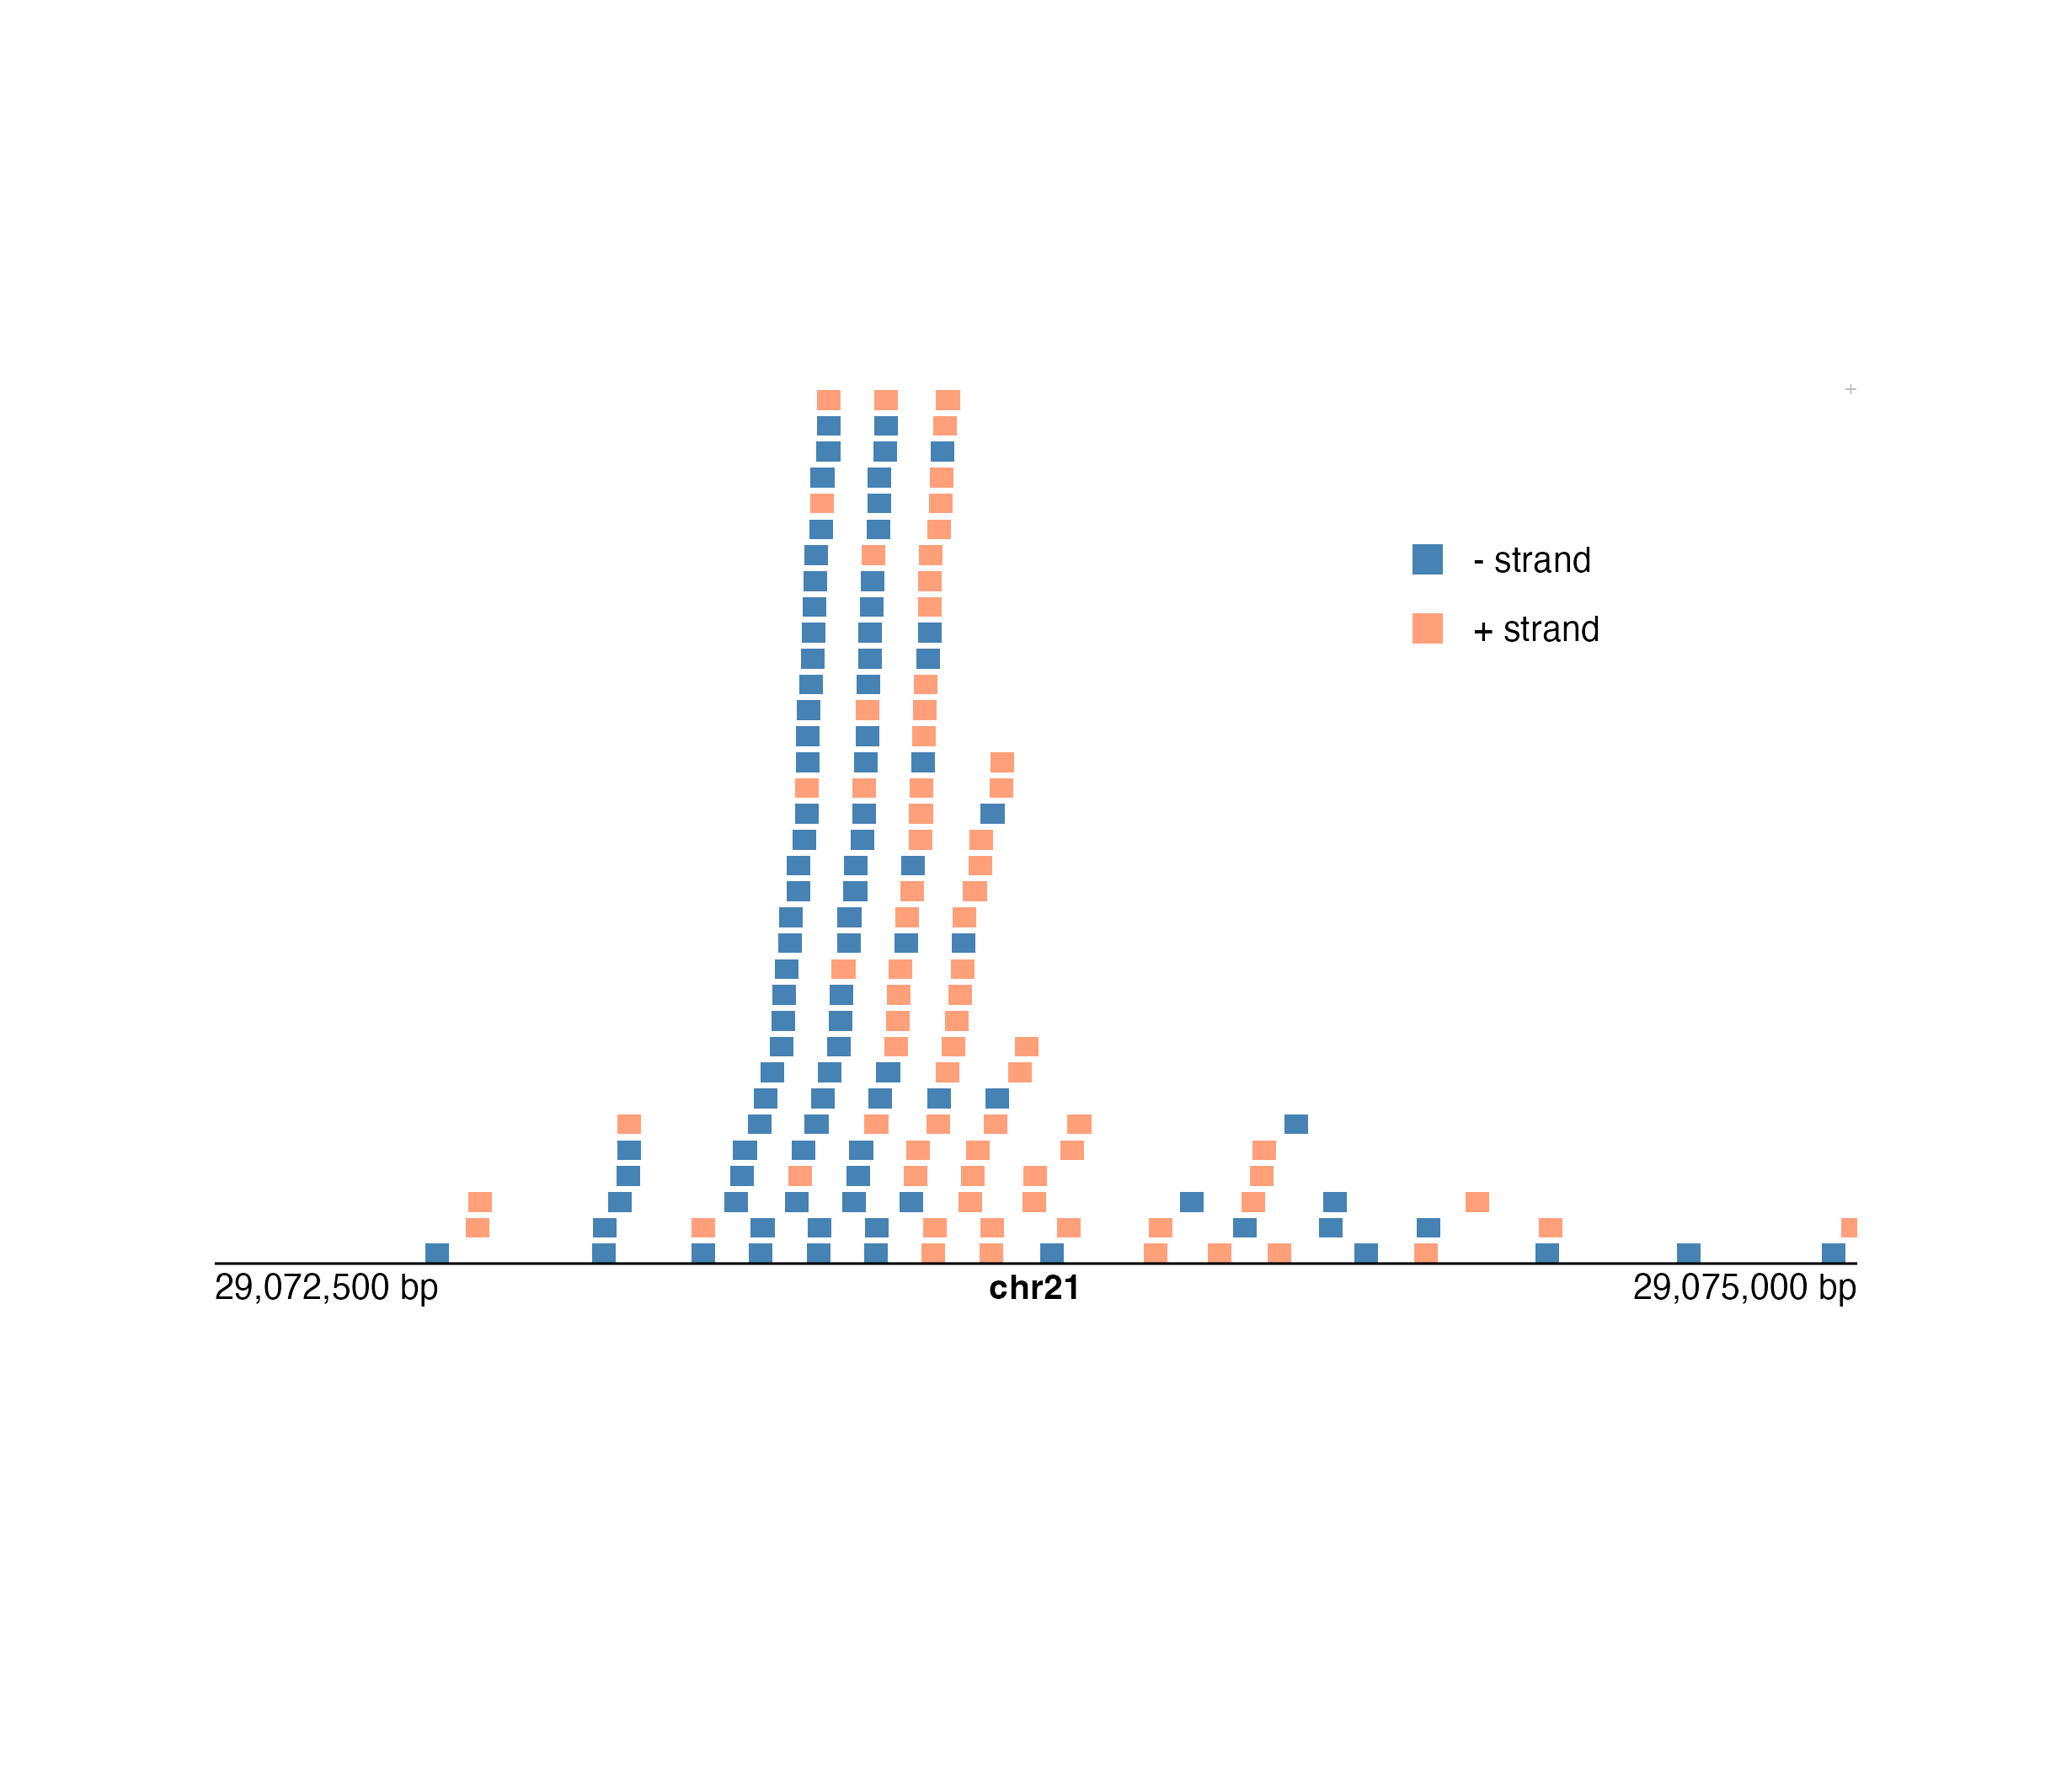
## Plot a pileup plot, coloring elements by strand
pileupPlot <- plotRanges(
data = IMR90_ChIP_CTCF_reads, chrom = "chr21",
chromstart = 29072500, chromend = 29075000,
assembly = "hg19",
fill = colorby("strand", palette =
colorRampPalette(c("steel blue", "light salmon"))),
x = 0.5, y = 3.5, width = 6.5, height = 3.5,
just = c("left", "bottom"),
default.units = "inches"
)
#> Warning: Not enough plotting space for all provided elements. ('+' indicates elements not shown.)
#> ranges[ranges1]
## Add a legend depicting strand colors
legendPlot <- plotLegend(
legend = c("- strand", "+ strand"),
fill = c("steel blue", "light salmon"),
border = FALSE,
x = 5, y = 0.5, width = 1.5, height = 0.7,
just = c("left", "top"),
default.units = "inches"
)
#> legend[legend1]
## Annotate genome label
annoGenomeLabel(
plot = pileupPlot, x = 0.5, y = 3.5,
just = c("left", "top")
)
 #> genomeLabel[genomeLabel1]
## Hide page guides
pageGuideHide()
#> genomeLabel[genomeLabel1]
## Hide page guides
pageGuideHide()