Plot genomic range elements in a pileup or collapsed format
plotRanges(
    data,
    chrom,
    chromstart = NULL,
    chromend = NULL,
    assembly = "hg38",
    fill = "#7ecdbb",
    linecolor = NA,
    order = "width",
    collapse = FALSE,
    boxHeight = unit(2, "mm"),
    spaceWidth = 0.02,
    spaceHeight = 0.3,
    limitLabel = TRUE,
    strandSplit = FALSE,
    bg = NA,
    baseline = FALSE,
    baseline.color = "grey",
    baseline.lwd = 1,
    x = NULL,
    y = NULL,
    width = NULL,
    height = NULL,
    just = c("left", "top"),
    default.units = "inches",
    draw = TRUE,
    params = NULL,
    ...
)
Arguments
- data
Data to be plotted; as a character value specifying a BED file path, a data frame in BED format, a character value specifying a .bam file path where a bam index file (.bam.bai) is in the same directory, or a GRanges object.
- chrom
Chromosome of region to be plotted, as a string.
- chromstart
Integer start position on chromosome to be plotted.
- chromend
Integer end position on chromosome to be plotted.
- assembly
Default genome assembly as a string or a assembly object. Default value is
assembly = "hg38".- fill
A single character value, a vector, or a colorby object specifying fill colors of range elements. Default value is
fill = "#7ecdbb".- linecolor
A single character value, a vector, or a colorby object specifying the color of the lines outlining range elements. Default value is
linecolor = NA. Special options include:NA:No line color.
"fill":Same color as
fill.
.
- order
A character value specifying how to order pileup data before assigning rows. Default value is
order = "width". Options include:"width":Ordered by decreasing width of elements.
"random":Ordered randomly in each function call.
.
- collapse
A logical value indicating whether to collapse range elements into a single row, or into two rows if
strandSplit = TRUE. Ifcollapse = TRUE,boxHeightwill be ignored and elements will be the height of the entire plot ifstrandSplit = FALSEor be the height of half of the entire plot ifstrandSplit = TRUE. Default value iscollapse = FALSE.- boxHeight
A numeric or unit object specifying height of range element boxes. Default value is
boxHeight = unit(2, "mm").- spaceWidth
A numeric value specifying the width of minimum spacing between range element boxes, as a fraction of the plot's genomic range. Default value is
spaceWidth = 0.02.- spaceHeight
A numeric value specifying the height of spacing between range element boxes on different rows, as a fraction of boxHeight. Default value is
spaceHeight = 0.3.- limitLabel
A logical value indicating whether to draw a "+" when not all elements can be plotted in the plotting space. Default value is
limitLabel = TRUE.- strandSplit
A logical value indicating whether plus and minus-stranded elements should be separated. Elements can only be split by strand if a
strandcolumn is found indata. Default value isstrandSplit = FALSE.- bg
Character value indicating background color. Default value is
bg = NA.- baseline
Logical value indicating whether to include a baseline along the x-axis. Default value is
baseline = FALSE.- baseline.color
Baseline color. Default value is
baseline.color = "grey".- baseline.lwd
Baseline line width. Default value is
baseline.lwd = 1.- x
A numeric or unit object specifying ranges plot x-location.
- y
A numeric, unit object, or character containing a "b" combined with a numeric value specifying ranges plot y-location. The character value will place the ranges plot y relative to the bottom of the most recently plotted plot according to the units of the plotgardener page.
- width
A numeric or unit object specifying ranges plot width.
- height
A numeric or unit object specifying ranges plot height.
- just
Justification of ranges plot relative to its (x, y) location. If there are two values, the first value specifies horizontal justification and the second value specifies vertical justification. Possible string values are:
"left","right","centre","center","bottom", and"top". Default value isjust = c("left", "top").- default.units
A string indicating the default units to use if
x,y,width, orheightare only given as numerics. Default value isdefault.units = "inches".- draw
A logical value indicating whether graphics output should be produced. Default value
draw = TRUE.- params
An optional pgParams object containing relevant function parameters.
- ...
Additional grid graphical parameters. See gpar.
Value
Returns a ranges object containing relevant
genomic region, coloring data, placement, and grob information.
Details
A ranges plot can be placed on a plotgardener coordinate page by providing plot placement parameters:
plotRanges(data, chrom,
            chromstart = NULL, chromend = NULL,
            x, y, width, height, just = c("left", "top"),
            default.units = "inches")
This function can also be used to quickly plot an unannotated BED plot by ignoring plot placement parameters:
plotRanges(data, chrom,
            chromstart = NULL, chromend = NULL)
Examples
## Load ranges data in BED format
library(plotgardenerData)
data("IMR90_ChIP_CTCF_reads")
## Create page
pageCreate(width = 7.5, height = 5, default.units = "inches")
## Plot and place a pileup ranges plot
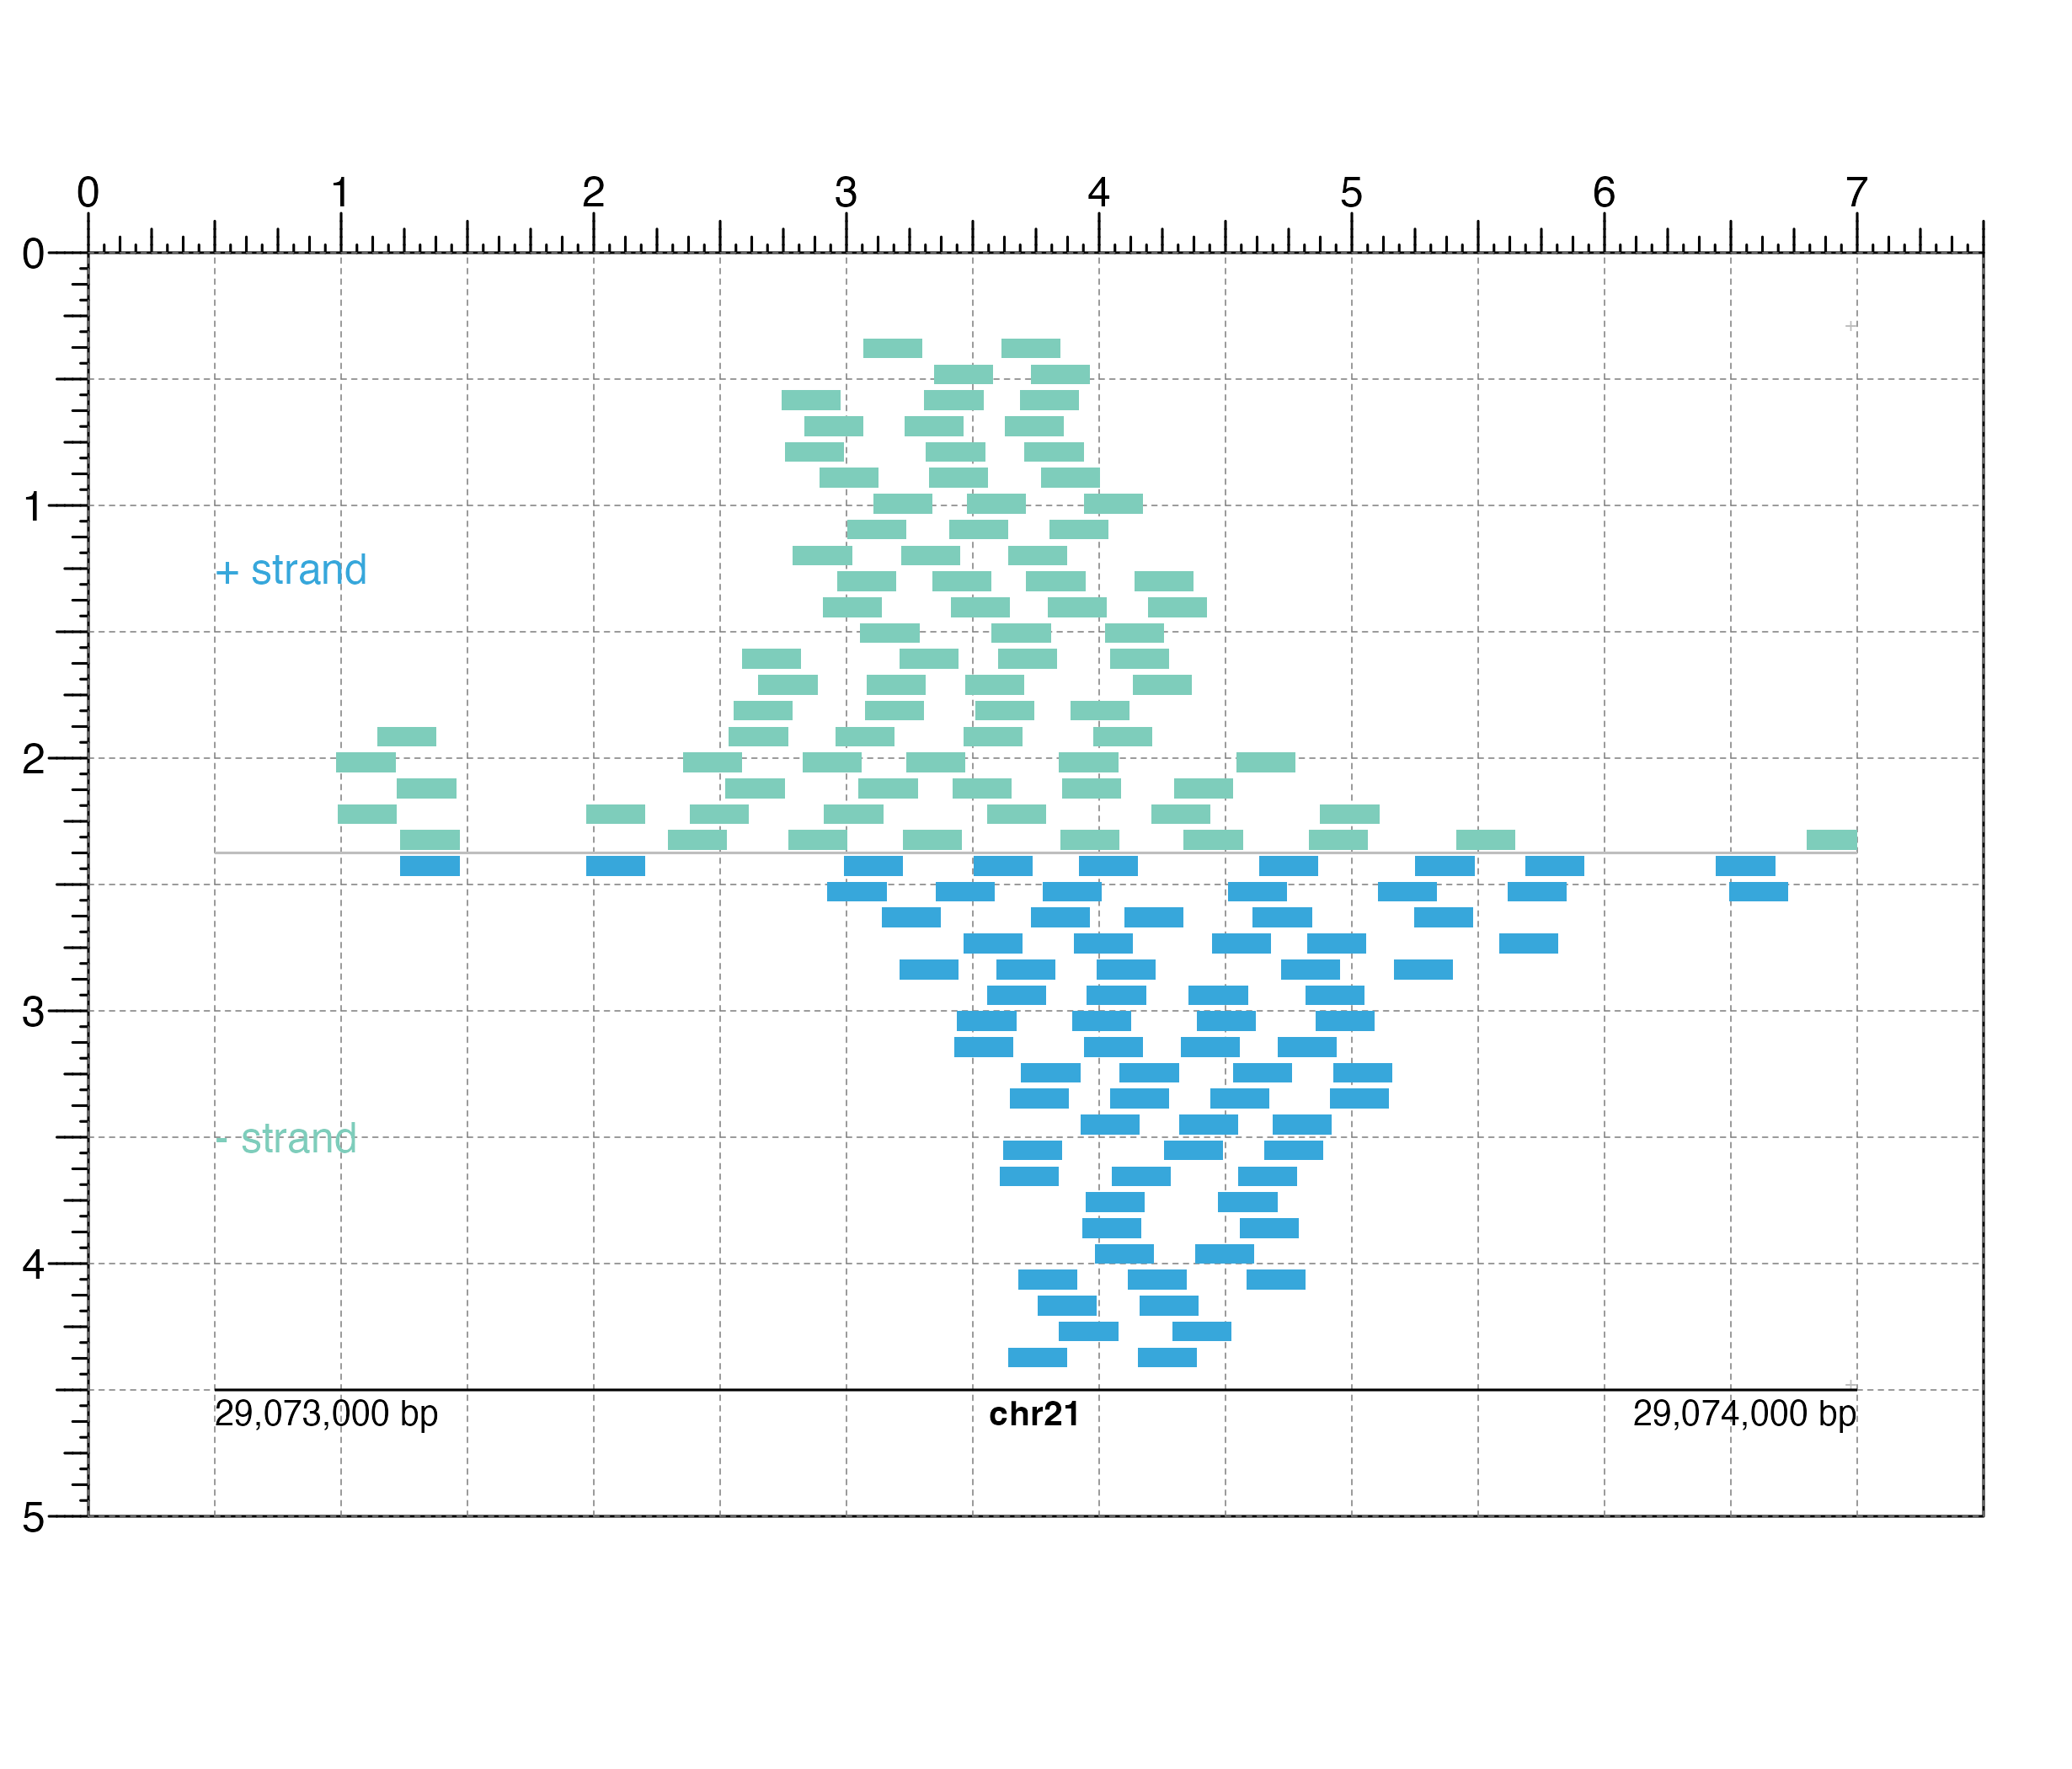
pileupPlot <- plotRanges(
data = IMR90_ChIP_CTCF_reads, chrom = "chr21",
chromstart = 29073000, chromend = 29074000,
assembly = "hg19",
order = "random",
fill = colorby("strand", palette =
colorRampPalette(c("#7ecdbb", "#37a7db"))),
strandSplit = TRUE,
x = 0.5, y = 0.25, width = 6.5, height = 4.25,
just = c("left", "top"), default.units = "inches"
)
#> Warning: Not enough plotting space for all provided elements. ('+' indicates elements not shown.)
#> Warning: Not enough plotting space for all provided elements. ('+' indicates elements not shown.)
#> ranges[ranges1]
## Annotate genome label
annoGenomeLabel(
plot = pileupPlot, x = 0.5, y = 4.5,
just = c("left", "top")
)
#> genomeLabel[genomeLabel1]
## Add text labels
plotText(
label = "+ strand", fontcolor = "#37a7db", fontsize = 12,
x = 0.5, y = 1.25, just = "left"
)
#> text[text1]
plotText(
label = "- strand", fontcolor = "#7ecdbb", fontsize = 12,
x = 0.5, y = 3.5, just = "left"
)
 #> text[text2]
## Hide page guides
pageGuideHide()
#> text[text2]
## Hide page guides
pageGuideHide()
