Plot gene transcripts in a pileup style for a single chromosome
Source:R/plotTranscripts.R
plotTranscripts.RdPlot gene transcripts in a pileup style for a single chromosome
plotTranscripts(
    chrom,
    chromstart = NULL,
    chromend = NULL,
    assembly = "hg38",
    fill = c("#669fd9", "#abcc8e"),
    colorbyStrand = TRUE,
    strandSplit = FALSE,
    boxHeight = unit(2, "mm"),
    spaceWidth = 0.02,
    spaceHeight = 0.3,
    limitLabel = TRUE,
    transcriptHighlights = NULL,
    transcriptFilter = NULL,
    fontsize = 8,
    labels = "transcript",
    stroke = 0.1,
    bg = NA,
    x = NULL,
    y = NULL,
    width = NULL,
    height = NULL,
    just = c("left", "top"),
    default.units = "inches",
    draw = TRUE,
    params = NULL
)
Arguments
- chrom
Chromosome of region to be plotted, as a string.
- chromstart
Integer start position on chromosome to be plotted.
- chromend
Integer end position on chromosome to be plotted.
- assembly
Default genome assembly as a string or a assembly object. Default value is
assembly = "hg38".- fill
Character value(s) as a single value or vector specifying fill colors of transcripts. Default value is
fill = c("#669fd9", "#abcc8e").- colorbyStrand
A logical value indicating whether to color plus and minus strands by the first two colors in a
fillvector, where plus strand transcripts will be colored by the firstfillcolor and minus strand transcripts will be colored by the secondfillcolor. Default value iscolorbyStrand = TRUE.- strandSplit
A logical value indicating whether plus and minus-stranded transcripts should be separated, with plus strand transcripts plotted above the x-axis and minus strand transcripts plotted below the x-axis. Default value is
strandSplit = FALSE.- boxHeight
A numeric or unit object specifying height of transcripts. Default value is
boxHeight = unit(2, "mm").- spaceWidth
A numeric value specifying the width of minimum spacing between transcripts, as a fraction of the plot's genomic range. Default value is
spaceWidth = 0.02.- spaceHeight
A numeric value specifying the height of spacing between transcripts on different rows, as a fraction of
boxHeight. Default value isspaceHeight = 0.3.- limitLabel
A logical value indicating whether to draw a "+" when not all elements can be plotted in the plotting space. Default value is
limitLabel = TRUE.- transcriptHighlights
A two-column dataframe with a column named "transcript" or "gene" containing transcript names or their associated gene names as strings to highlight and a column named "color" containing corresponding highlight colors.
- transcriptFilter
A character vector of the names of transcripts to display (default is
NULL, no filtering)- fontsize
A numeric specifying text fontsize in points. Default value is
fontsize = 8.- labels
A character value describing the format of transcript text labels. Default value is
labels = "trancript". Options are:NULL:No labels.
"transcript":Transcript name labels.
"gene":Gene name labels.
"both":Combined transcript and gene name labels with the format "gene name:transcript name".
- stroke
A numeric value indicating the stroke width for transcript body outlines. Default value is
stroke = 0.1.- bg
Character value indicating background color. Default value is
bg = NA.- x
A numeric or unit object specifying transcript plot x-location.
- y
A numeric, unit object, or character containing a "b" combined with a numeric value specifying transcript plot y-location. The character value will place the transcript plot y relative to the bottom of the most recently plotted plot according to the units of the plotgardener page.
- width
A numeric or unit object specifying transcript plot width.
- height
A numeric or unit object specifying transcript plot height.
- just
Justification of transcript plot relative to its (x, y) location. If there are two values, the first value specifies horizontal justification and the second value specifies vertical justification. Possible string values are:
"left","right","centre","center","bottom", and"top". Default value isjust = c("left", "top").- default.units
A string indicating the default units to use if
x,y,width, orheightare only given as numerics. Default value isdefault.units = "inches".- draw
A logical value indicating whether graphics output should be produced. Default value is
draw = TRUE.- params
An optional pgParams object containing relevant function parameters.
Value
Returns a transcripts object containing relevant
genomic region, placement, and grob information.
Details
A transcripts plot can be placed on a plotgardener coordinate page by providing plot placement parameters:
plotTranscripts(chrom, chromstart = NULL, chromend = NULL,
                x, y, width, height, just = c("left", "top"),
                default.units = "inches")
This function can also be used to quickly plot an unannotated transcripts plot by ignoring plot placement parameters:
plotTranscripts(chrom, chromstart = NULL, chromend = NULL)Genomic annotation information is acquired through
TxDb and OrgDb-class packages,
as determined through the assembly parameter.
See also
Examples
## Load hg19 genomic annotation packages
library("TxDb.Hsapiens.UCSC.hg19.knownGene")
library("org.Hs.eg.db")
## Create page
pageCreate(width = 7.5, height = 3.5, default.units = "inches")
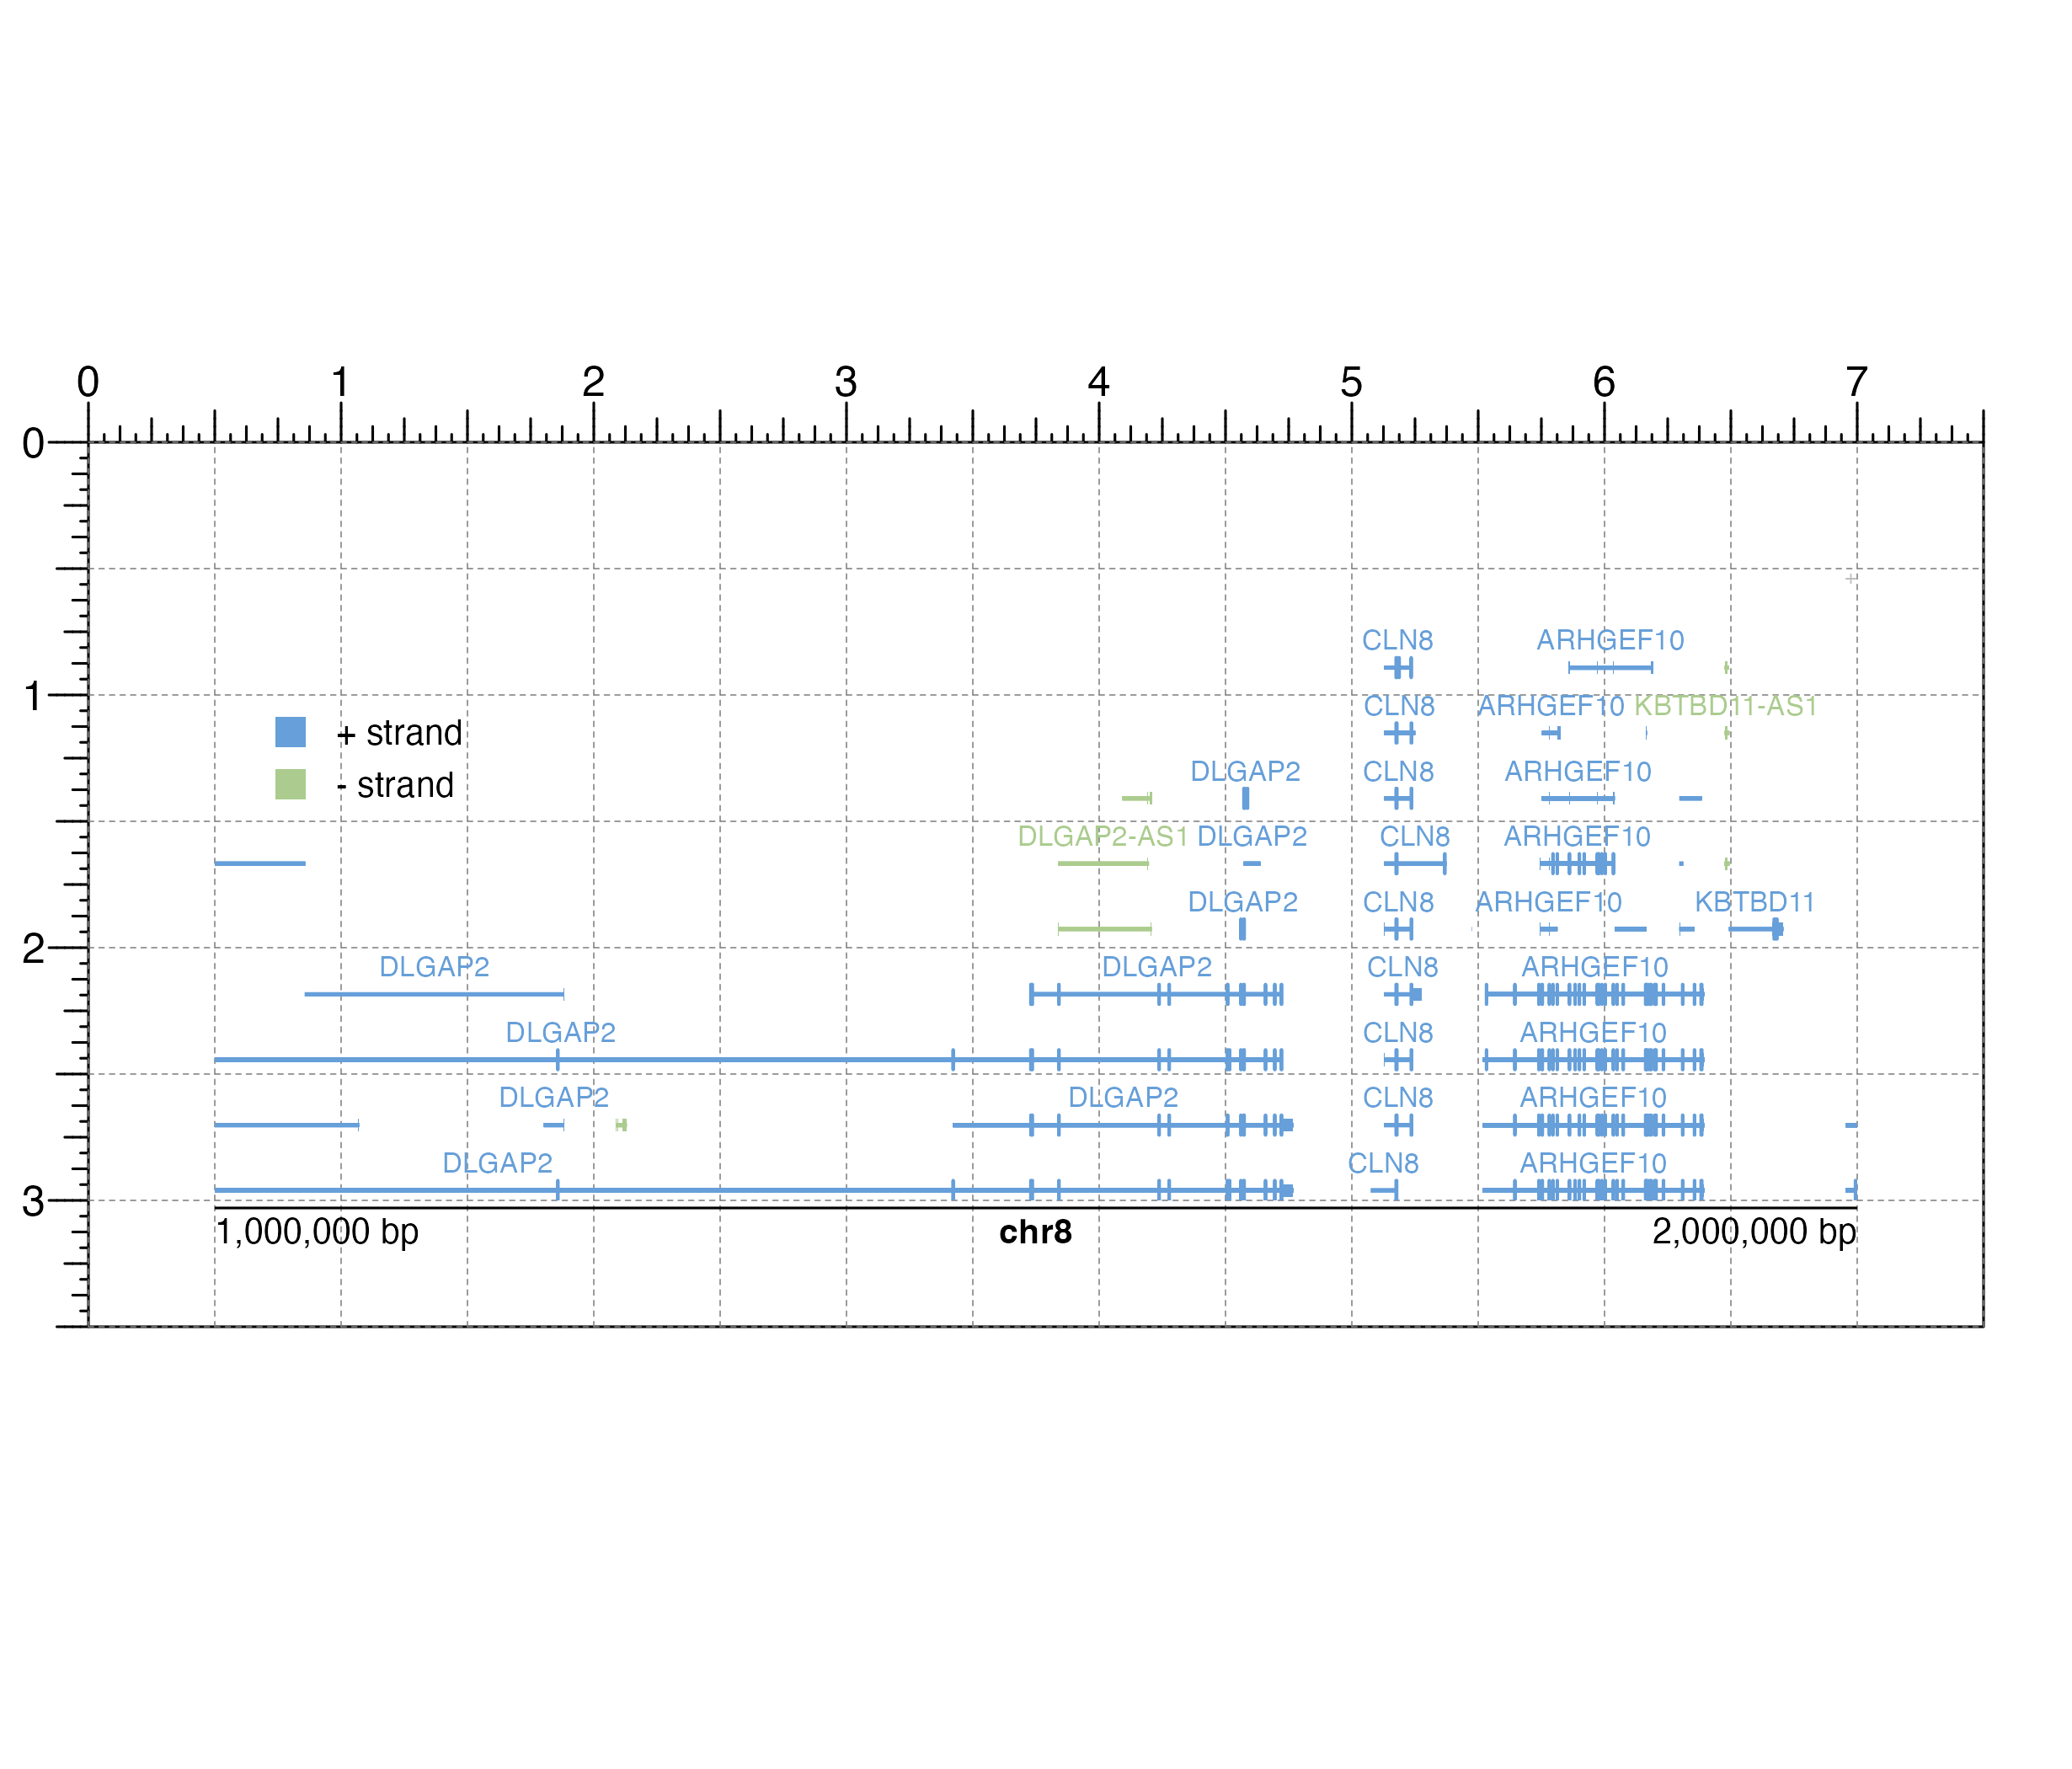
## Plot and place transcripts
plotTranscripts(
chrom = "chr8", chromstart = 1000000, chromend = 2000000,
assembly = "hg19", labels = "gene",
x = 0.5, y = 0.5, width = 6.5, height = 2.5,
just = c("left", "top"), default.units = "inches"
)
#> Warning: Not enough plotting space for all provided elements. ('+' indicates elements not shown.)
#> transcripts[transcripts1]
## Plot genome label
plotGenomeLabel(
chrom = "chr8", chromstart = 1000000, chromend = 2000000,
assembly = "hg19",
x = 0.5, y = 3.03, length = 6.5, default.units = "inches"
)
#> genomeLabel[genomeLabel1]
## Plot a legend
plotLegend(
legend = c("+ strand", "- strand"),
fill = c("#669fd9", "#abcc8e"), border = FALSE,
x = 0.5, y = 1, width = 1, height = 0.5,
just = c("left", "top")
)
 #> legend[legend1]
## Hide page guides
pageGuideHide()
#> legend[legend1]
## Hide page guides
pageGuideHide()
