Getting Started with the Plotgardener App
Source:vignettes/guides/plotgardenerApp_getting_started.Rmd
plotgardenerApp_getting_started.RmdWhat is the Plotgardener App?
plotgardener is an R/Bioconductor package for building
flexible, multi-panel, publication-quality genomic visualizations. It
has been downloaded over a thousand times and cited in over 100 papers,
but using it requires proficiency in R, package management, and the
command line. For many biologists, that can be a significant
barrier.
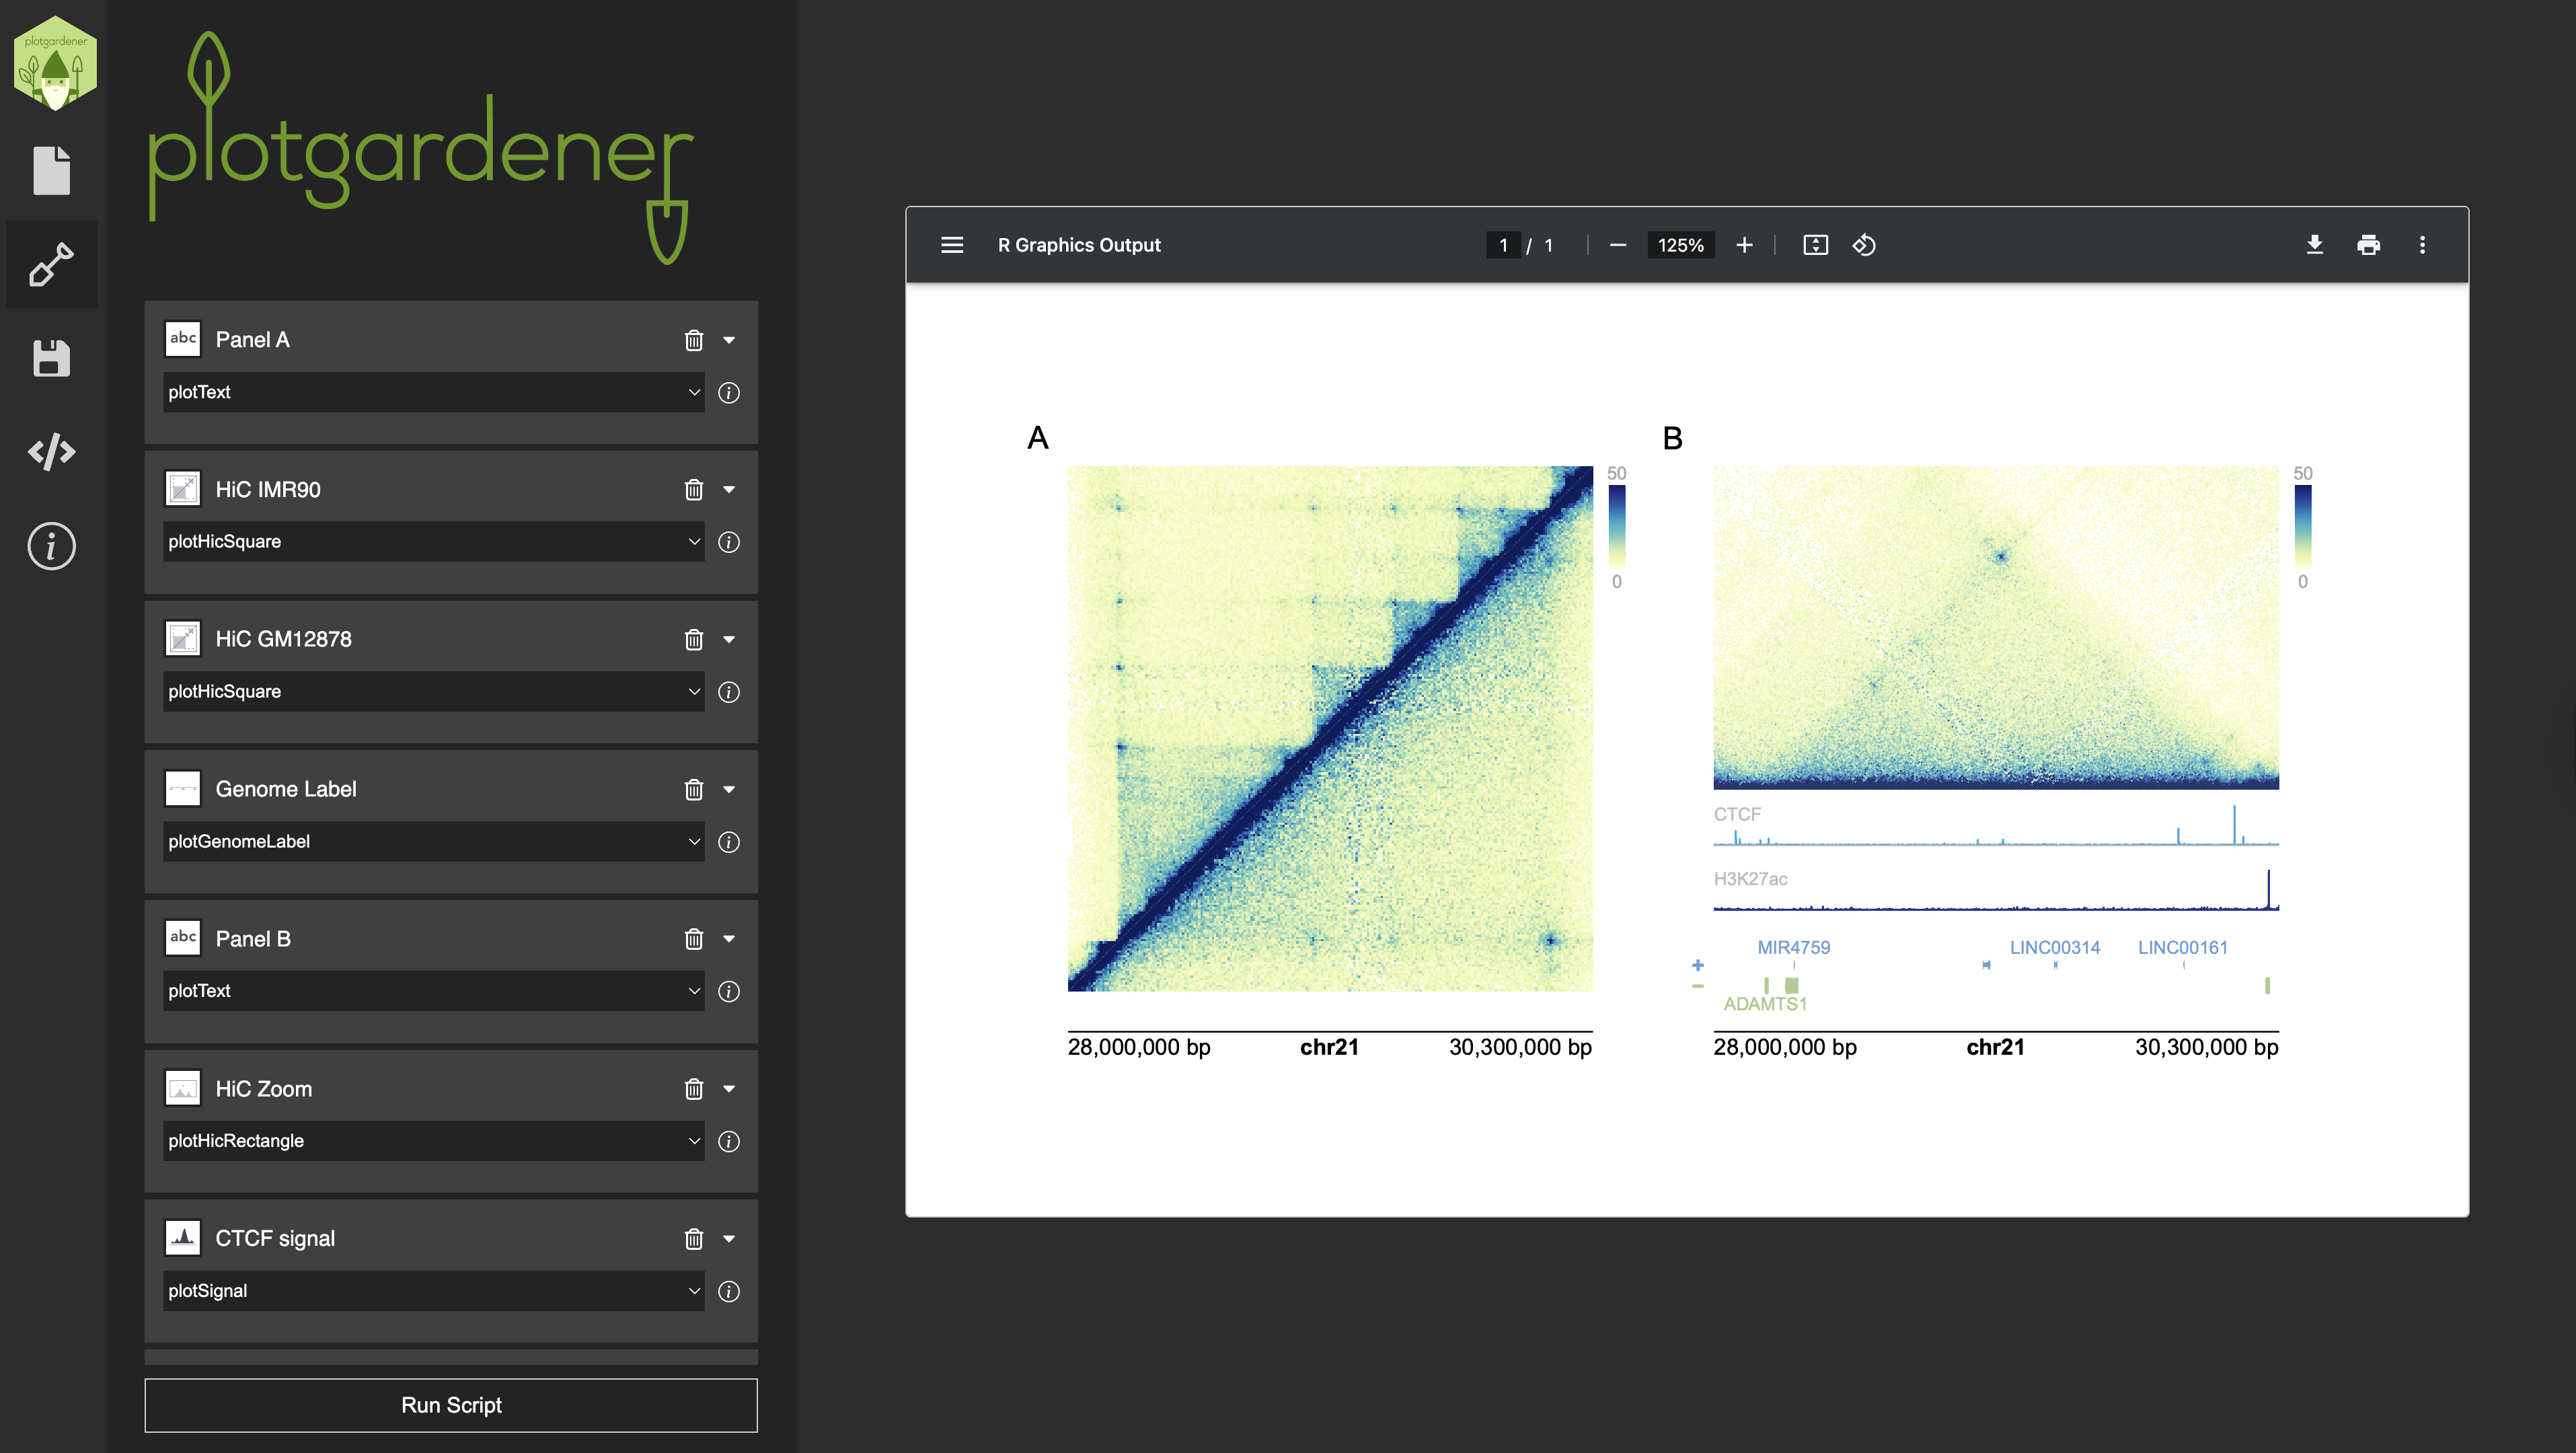
The Plotgardener App is a desktop application that wraps the
plotgardener R package in a graphical interface, making its
full feature set available in a no-code environment. Users can add and
configure Hi-C contact maps, signal tracks, gene models, genome labels,
and more, all through point-and-click menus. A live rendering of the
figure updates as you work, and at any point the app displays the
underlying R script so that advanced users can copy and extend it
further in any IDE.
Key Features
- No-code visualization: Build multipanel genomic figures through point-and-click menus — no R required.
- Live figure preview: See a rendered figure update in real time as you configure and add panels.
- Code transparency: The app generates and displays the underlying R script at any point, enabling advanced users to copy, modify, and extend their figures in any IDE.
-
Dynamic interface: A built-in Python parser reads
the live
plotgardenerR package source to automatically populate supported functions, parameters, and documentation — the interface stays synchronized with package updates without manual maintenance. - Session saving: Save and reload entire figure sessions as structured JSON files, enabling reusable templates and easy collaboration.
Platform Support
The Plotgardener App requires macOS (Apple Silicon M1/M2/M3 or Intel). Windows and Linux are not supported at this time. See Install the Plotgardener App for download and installation instructions.
Under the Hood
The Plotgardener App is built on Electron and comprises
three layers:
-
Frontend (
React): Renders all user-facing tabs and form elements, dynamically populated based on the selectedplotgardenerfunction. -
Backend (
Node.js): Manages all parameter inputs, maintains panel state across additions and edits, compiles the final R script, and returns the PDF output to the preview pane. -
Parser (
Python): Parses the liveplotgardenerR package source — functions, parameters, and documentation — into structured JSON. This keeps the interface automatically synchronized with any updates to the package, with no manual maintenance required.
Next Steps
- Install the Plotgardener App — download and installation instructions for macOS
- User Interface — a walkthrough of all four sections and a typical figure-building workflow
Source Code
- The Plotgardener App: github.com/rishabhsvemuri/ThePlotgardenerApp
-
plotgardenerR package: phanstiellab.github.io/plotgardener