Plot paired-end genomic range elements
plotPairs(
    data,
    chrom,
    chromstart = NULL,
    chromend = NULL,
    assembly = "hg38",
    fill = "#1f4297",
    linecolor = NA,
    bg = NA,
    boxHeight = unit(2, "mm"),
    spaceWidth = 0.02,
    spaceHeight = 0.3,
    limitLabel = TRUE,
    baseline = FALSE,
    baseline.color = "grey",
    baseline.lwd = 1,
    x = NULL,
    y = NULL,
    width = NULL,
    height = NULL,
    just = c("left", "top"),
    default.units = "inches",
    draw = TRUE,
    params = NULL,
    ...
)
Arguments
- data
A string specifying the BEDPE file path, a dataframe in BEDPE format specifying data to be plotted, or a GInteractions object.
- chrom
Chromosome of region to be plotted, as a string.
- chromstart
Integer start position on chromosome to be plotted.
- chromend
Integer end position on chromosome to be plotted.
- assembly
Default genome assembly as a string or a assembly object. Default value is
assembly = "hg38".- fill
A single character value, a vector, or a colorby object specifying fill colors of paired range elements. Default value is
fill = "#1f4297".- linecolor
A single character value, a vector, or a colorby object specifying the color of the lines outlining paired range elements. Default value is
linecolor = NA. Special options include:NA:No line color.
"fill":Same color as
fill.
- bg
Character value indicating background color. Default value is
bg = NA.- boxHeight
A numeric or unit object specifying height of boxes at either end of paired range elements. Default value is
boxHeight = unit(2, "mm").- spaceWidth
A numeric specifying the width of spacing between paired range elements, as a fraction of the plot's genomic range. Default value is
spaceWidth = 0.02.- spaceHeight
A numeric specifying the height of space between boxes of paired range elements on different rows. Default value is
spaceHeight = 0.3.- limitLabel
A logical value indicating whether to draw a "+" when not all elements can be plotted in the plotting space. Default value is
limitLabel = TRUE.- baseline
Logical value indicating whether to include a baseline along the x-axis. Default value is
baseline = FALSE.- baseline.color
Baseline color. Default value is
baseline.color = "grey".- baseline.lwd
Baseline line width. Default value is
baseline.lwd = 1.- x
A numeric or unit object specifying paired range plot x-location.
- y
A numeric, unit object, or character containing a "b" combined with a numeric value specifying paired range plot y-location. The character value will place the paired range plot y relative to the bottom of the most recently plotted plot according to the units of the plotgardener page.
- width
A numeric or unit object specifying paired range plot width.
- height
A numeric or unit object specifying paired range plot height.
- just
Justification of paired range plot relative to its (x, y) location. If there are two values, the first value specifies horizontal justification and the second value specifies vertical justification. Possible string values are:
"left","right","centre","center","bottom", and"top". Default value isjust = c("left", "top").- default.units
A string indicating the default units to use if
x,y,width, orheightare only given as numerics. Default value isdefault.units = "inches".- draw
A logical value indicating whether graphics output should be produced.
- params
An optional pgParams object containing relevant function parameters.
- ...
Additional grid graphical parameters. See gpar.
Value
Returns a pairs object containing relevant
genomic region, placement, and grob information.
Details
#' A paired ranges plot can be placed on a plotgardener coordinate page by providing plot placement parameters:
plotPairs(data, chrom,
            chromstart = NULL, chromend = NULL,
            x, y, width, height, just = c("left", "top"),
            default.units = "inches")
This function can also be used to quickly plot an unannotated paired ranges plot by ignoring plot placement parameters:
plotPairs(data, chrom,
            chromstart = NULL, chromend = NULL)
Examples
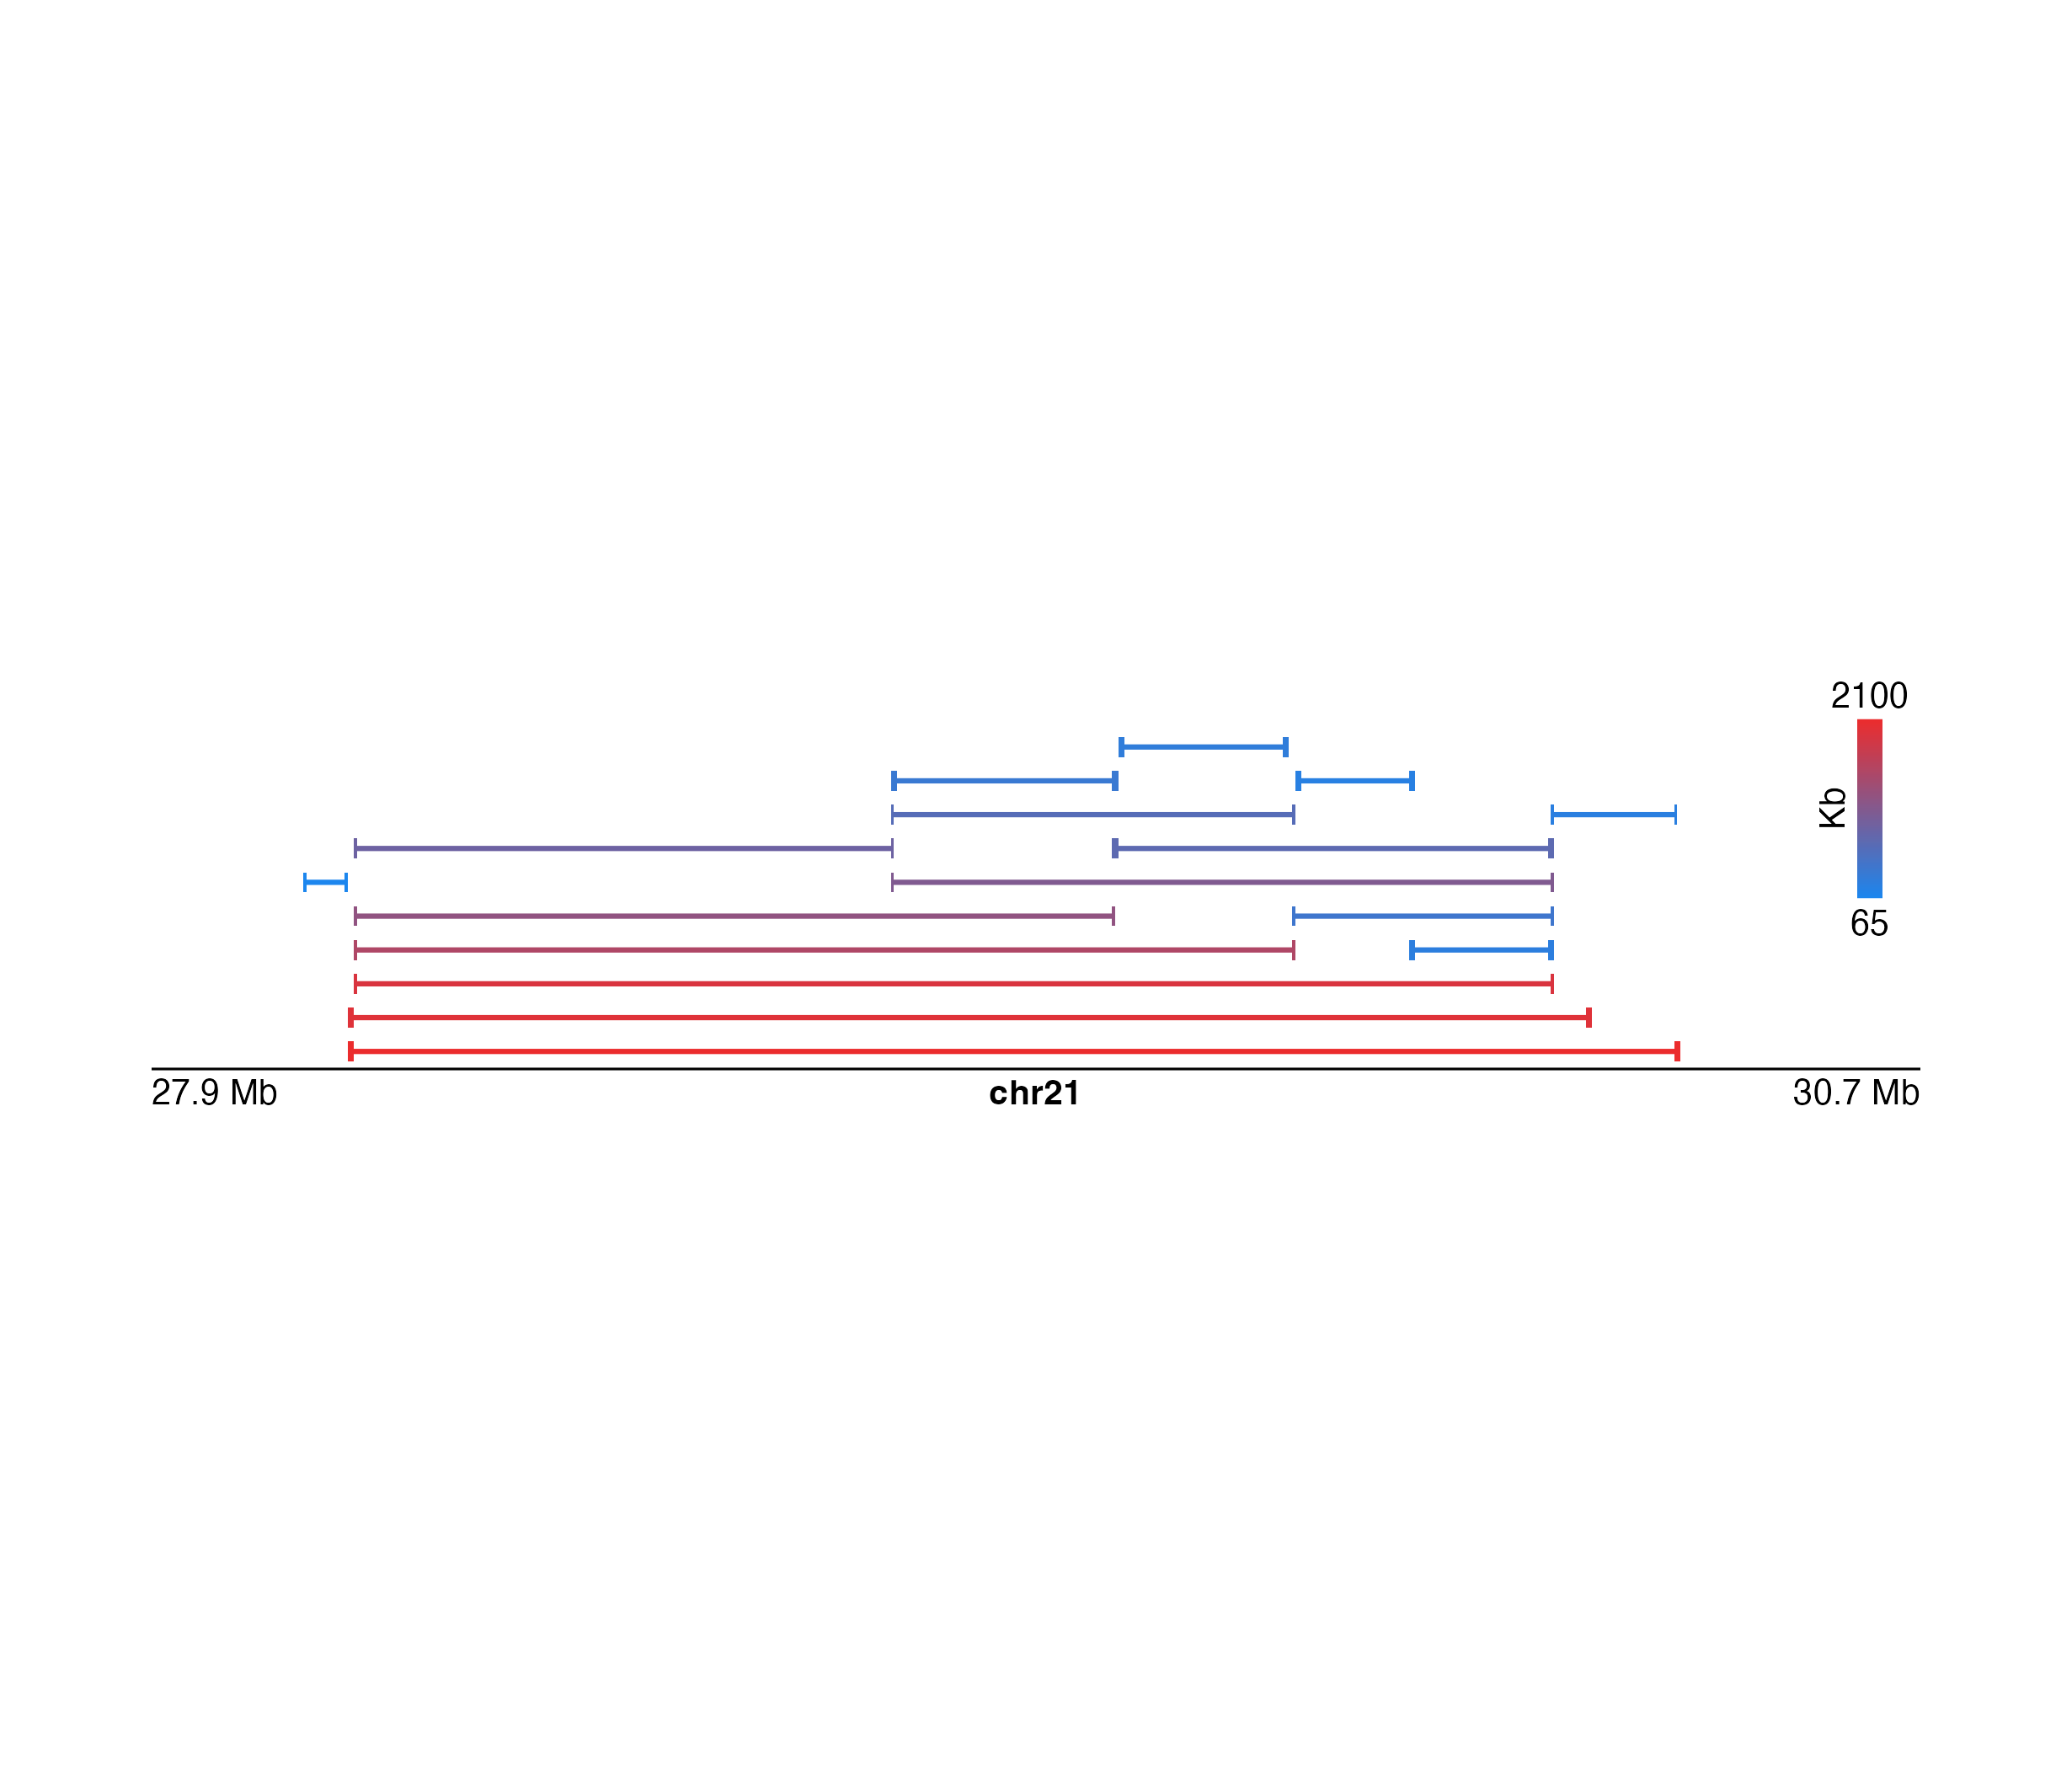
## Load paired ranges data in BEDPE format
library(plotgardenerData)
data("IMR90_DNAloops_pairs")
## Set the coordinates
params <- pgParams(
chrom = "chr21",
chromstart = 27900000, chromend = 30700000,
assembly = "hg19",
width = 7
)
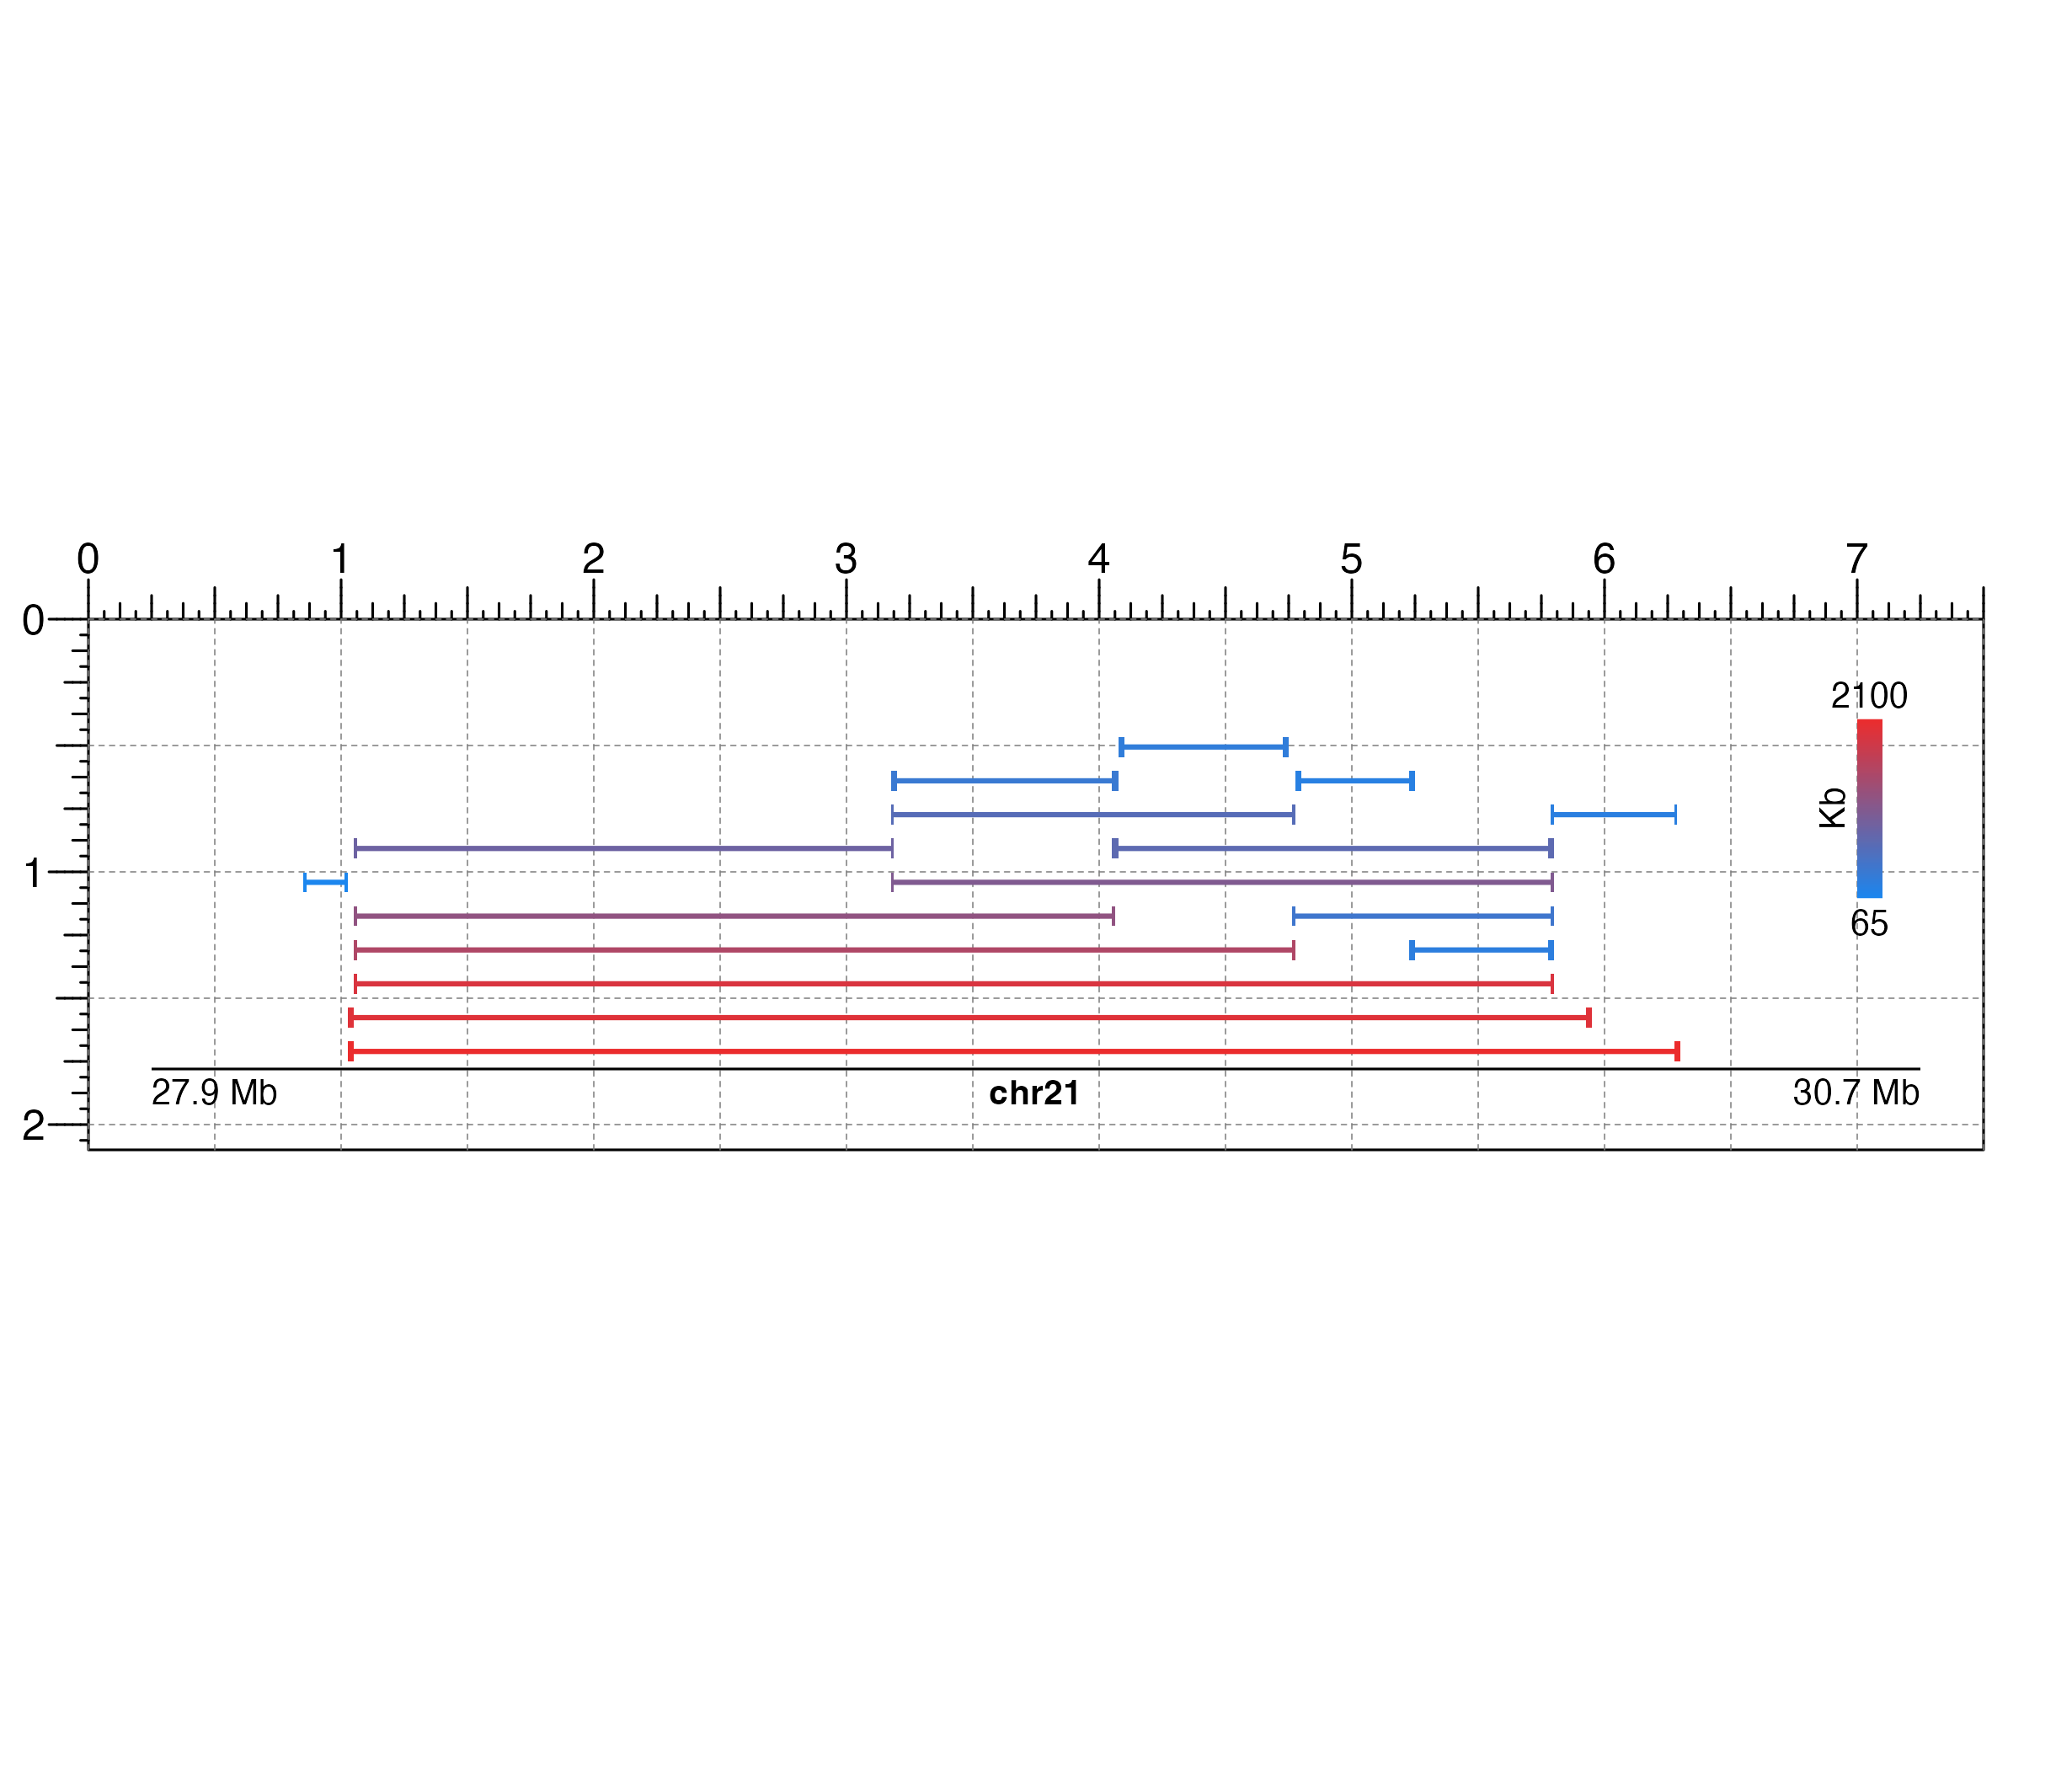
## Create a page
pageCreate(width = 7.5, height = 2.1, default.units = "inches")
## Add a length column
IMR90_DNAloops_pairs$length <-
(IMR90_DNAloops_pairs$start2 - IMR90_DNAloops_pairs$start1) / 1000
## Plot the data
bedpePlot <- plotPairs(
data = IMR90_DNAloops_pairs, params = params,
fill = colorby("length", palette =
colorRampPalette(c("dodgerblue2", "firebrick2"))),
lwd = 2, spaceHeight = .7,
x = 0.25, y = 0.25, height = 1.5,
just = c("left", "top"), default.units = "inches"
)
#> pairs[pairs1]
## Annotate genome label
annoGenomeLabel(plot = bedpePlot, x = 0.25, y = 1.78, scale = "Mb")
#> genomeLabel[genomeLabel1]
## Add heatmap legend
annoHeatmapLegend(
plot = bedpePlot, fontcolor = "black",
x = 7.0, y = 0.25,
width = 0.10, height = 1, fontsize = 10
)
#> heatmapLegend[heatmapLegend1]
## Add heatmap legend label
plotText(
label = "Kb", rot = 90, x = 6.9, y = 0.75,
just = c("center", "center"), fontsize = 10
)
 #> text[text1]
## Hide page guides
pageGuideHide()
#> text[text1]
## Hide page guides
pageGuideHide()