Annotates a line segment within a plot
annoSegments(
    x0,
    y0,
    x1,
    y1,
    plot,
    default.units = "native",
    linecolor = "black",
    lwd = 1,
    lty = 1,
    lineend = "butt",
    linejoin = "mitre",
    arrow = NULL,
    params = NULL,
    ...
)
Arguments
- x0
A numeric vector or unit object indicating the starting x-values of the line segments.
- y0
A numeric vector or unit object indicating the starting y-values of the line segments.
- x1
A numeric vector or unit object indicating the stopping x-values of the line segments.
- y1
A numeric vector or unit object indicating the stopping y-values of the line segments.
- plot
Input plotgardener plot to internally plot line segments relative to.
- default.units
A string indicating the default units to use if
x0,y0,x1, ory1are only given as numeric vectors. Default value isdefault.units = "native".- linecolor
A character value specifying segment line color. Default value is
linecolor = "black".- lwd
A numeric specifying segment line width. Default value is
lwd = 1.- lty
A numeric specifying segment line type. Default value is
lty = 1.- lineend
A character value specifying line end style. Default value is
lineend = "butt". Options are:"round":Segment ends are rounded.
"butt":Segment ends end exactly where ended.
"square":Segment ends are squared.
- linejoin
A character value specifying line join style. Default value is
linejoin = "mitre". Options are:"round":Line joins are rounded.
"mitre":Line joins are sharp corners.
"bevel":Line joins are flattened corners.
- arrow
A list describing arrow heads to place at either end of the line segments, as produced by the arrow function.
- params
An optional pgParams object containing relevant function parameters.
- ...
Additional grid graphical parameters. See gpar.
Value
Returns a segments object containing relevant
placement and grob information.
See also
Examples
library(grid)
## Create a page
pageCreate(width = 7.5, height = 2.5, default.units = "inches")
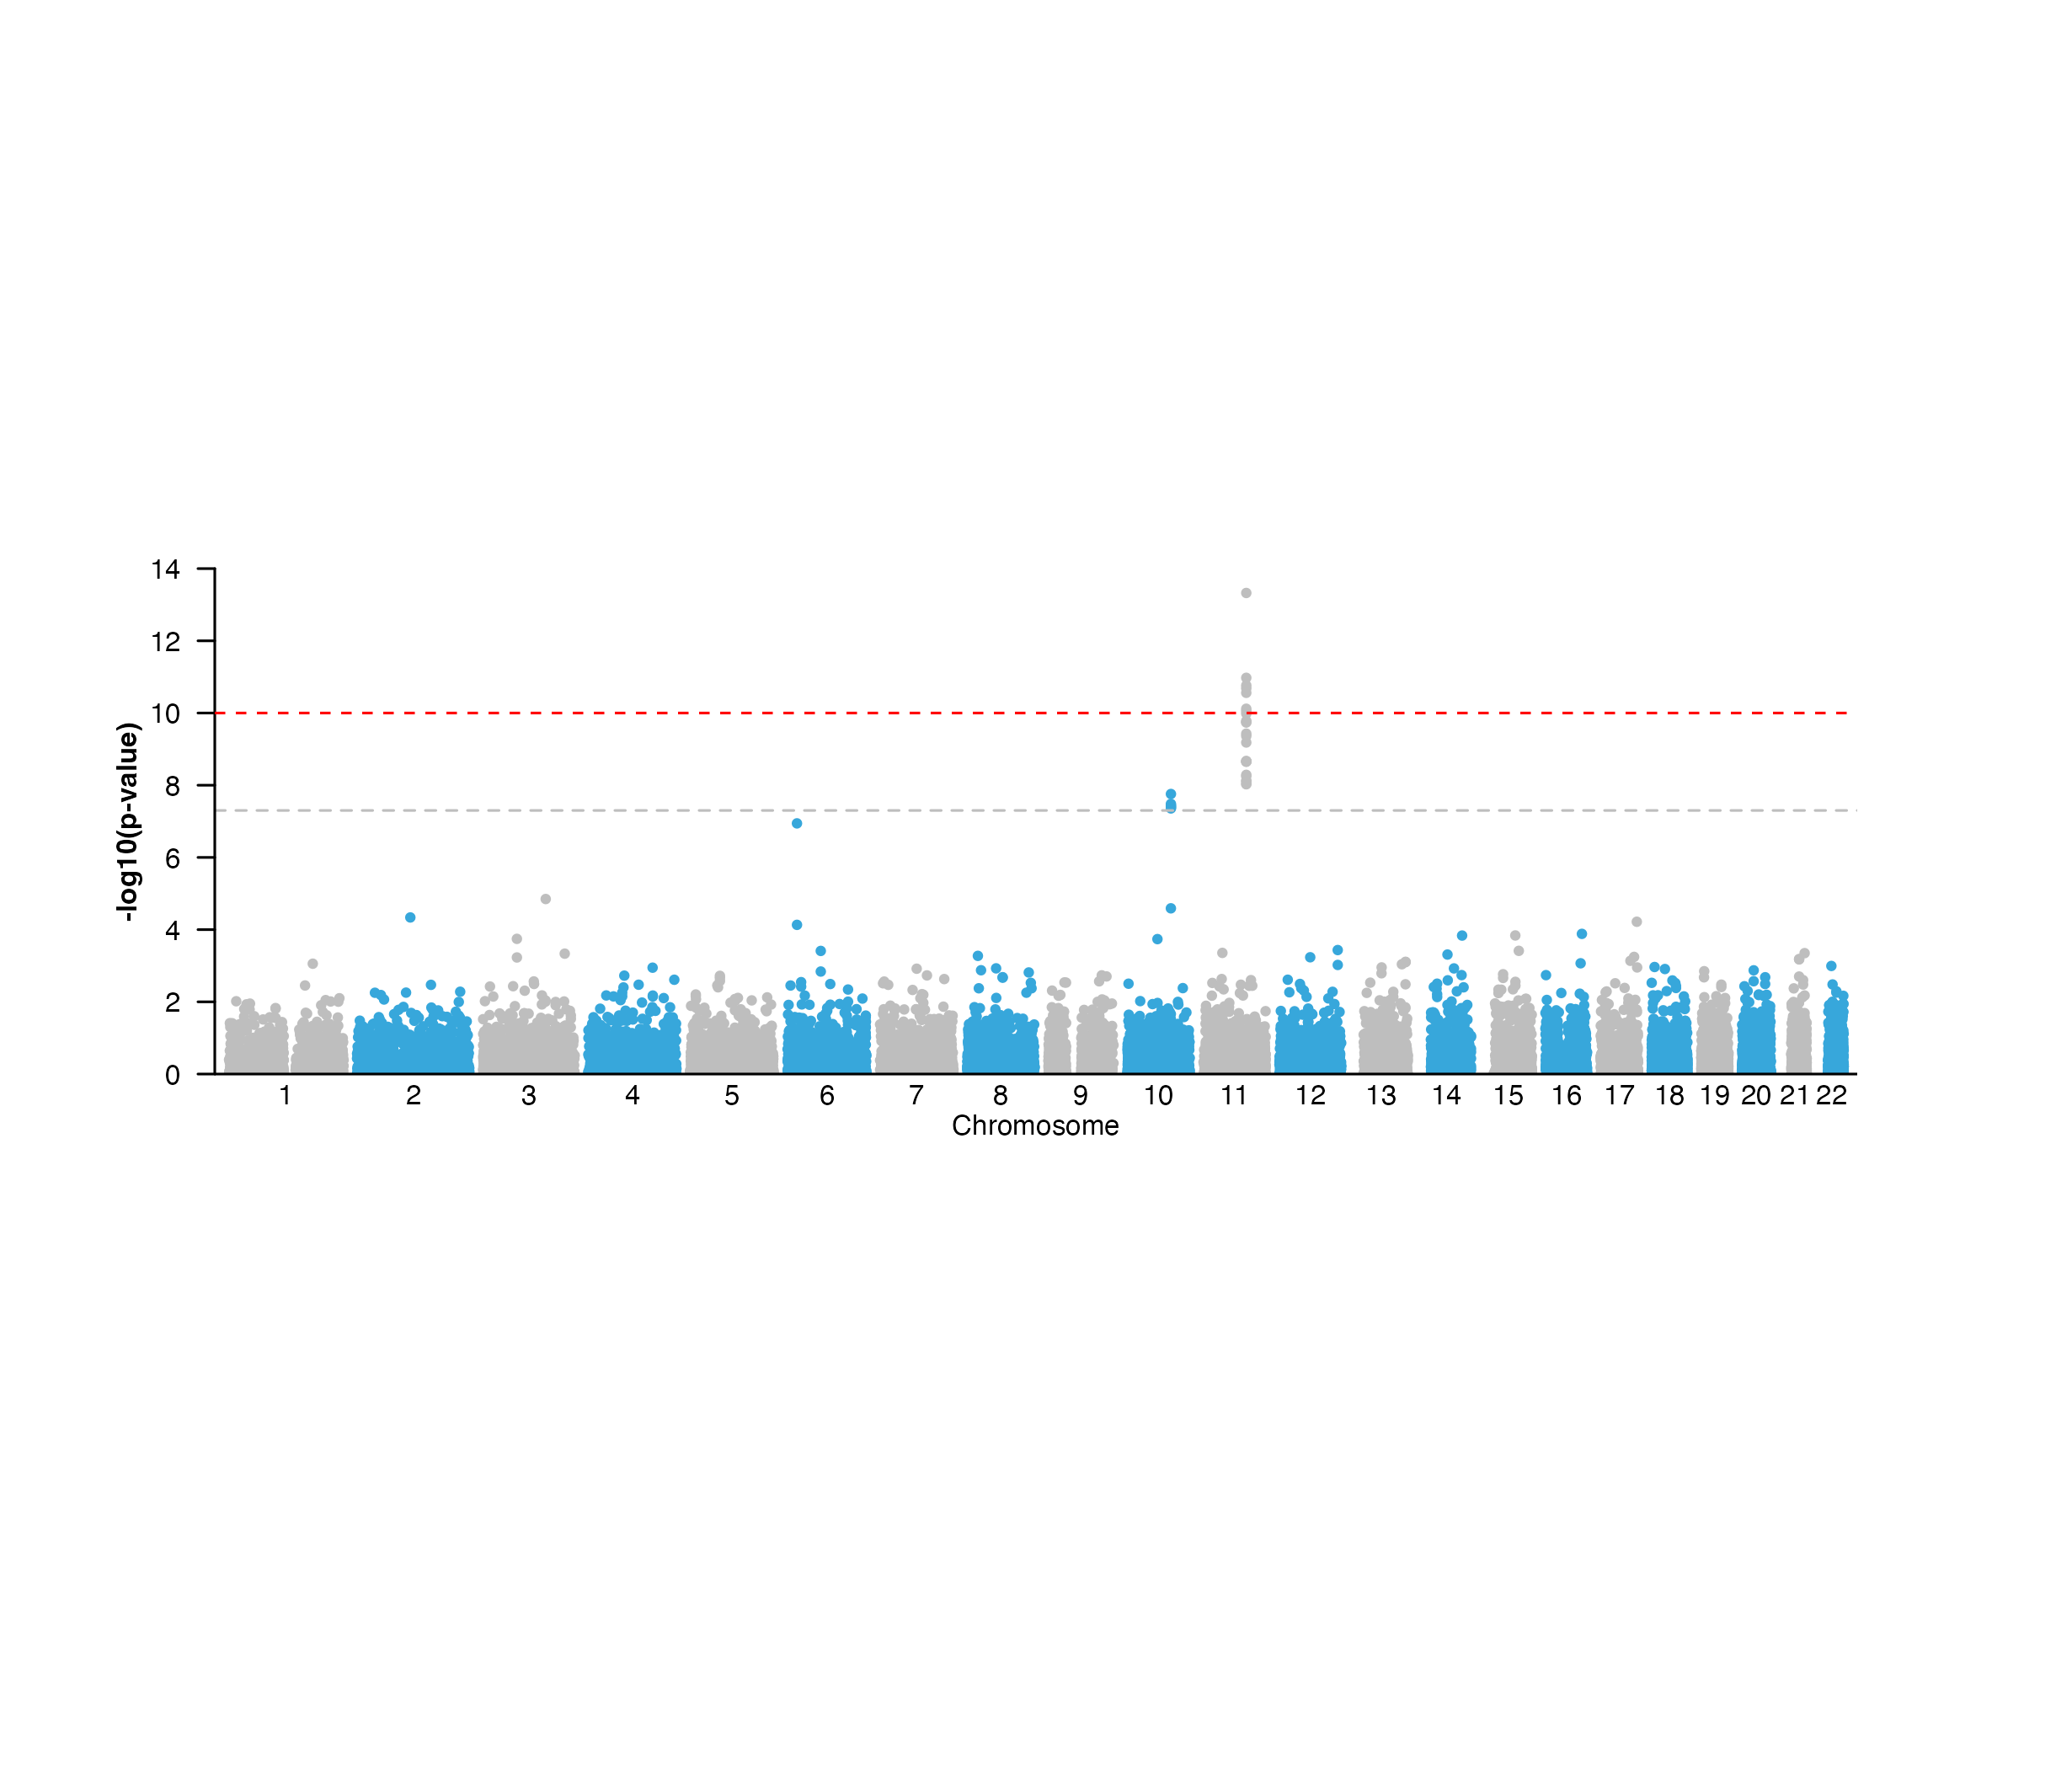
## Plot a Manhattan plot
library(plotgardenerData)
library("TxDb.Hsapiens.UCSC.hg19.knownGene")
data("hg19_insulin_GWAS")
manhattanPlot <- plotManhattan(
data = hg19_insulin_GWAS, assembly = "hg19",
fill = c("grey", "#37a7db"),
sigLine = TRUE,
col = "grey", lty = 2, range = c(0, 14),
x = 0.5, y = 0, width = 6.5, height = 2,
just = c("left", "top"),
default.units = "inches"
)
#> manhattan[manhattan1]
## Annotate genome label
annoGenomeLabel(
plot = manhattanPlot, x = 0.5, y = 2, fontsize = 8,
just = c("left", "top"),
default.units = "inches"
)
#> genomeLabel[genomeLabel1]
plotText(
label = "Chromosome", fontsize = 8,
x = 3.75, y = 2.20, just = "center", default.units = "inches"
)
#> text[text1]
## Annotate y-axis
annoYaxis(
plot = manhattanPlot, at = c(0, 2, 4, 6, 8, 10, 12, 14),
axisLine = TRUE, fontsize = 8
)
#> yaxis[yaxis1]
## Annotate a line segment for an additional significance line of
## the Manhattan plot
annoSegments(
x0 = unit(0, "npc"), y0 = 10,
x1 = unit(1, "npc"), y1 = 10,
plot = manhattanPlot, default.units = "native",
linecolor = "red", lty = 2
)
#> segments[segments1]
## Plot y-axis label
plotText(
label = "-log10(p-value)", x = 0.15, y = 1, rot = 90,
fontsize = 8, fontface = "bold", just = "center",
default.units = "inches"
)
 #> text[text2]
## Hide page guides
pageGuideHide()
#> text[text2]
## Hide page guides
pageGuideHide()