Plot multiple signal tracks in line with each other
plotMultiSignal(
   data,
   binSize = NA,
   binCap = TRUE,
   negData = FALSE,
   chrom,
   chromstart = NULL,
   chromend = NULL,
   assembly = "hg38",
   linecolor= "#37a7db",
   fill = NA,
   ymax = 1,
   range = NULL,
   scale = FALSE,
   label = NULL,
   bg = NA,
   baseline = TRUE,
   baseline.color = "grey",
   baseline.lwd = 1,
   orientation = "h",
   x = NULL,
   y = NULL,
   width = NULL,
   height = NULL,
   just = c("left", "top"),
   gapdistance = .2,
   default.units = "inches",
   draw = TRUE,
   params = NULL, ...
)
Arguments
- data
List of data to be plotted as character values specifying multiple bigwig file paths, dataframes in BED format, or GRanges objects with metadata column
score.- binSize
A numeric specifying the length of each data bin in basepairs. Default value is
binSize = NA.- binCap
A logical value indicating whether the function will limit the number of data bins to 8,000. Default value is
binCap = TRUE.- negData
A logical value indicating whether any of the data has both positive and negative scores and the y-axis of each signal track should be split. Default value is
negData = FALSE.- chrom
Chromosome of region to be plotted, as a string.
- chromstart
Integer start position on chromosome to be plotted.
- chromend
Integer end position on chromosome to be plotted.
- assembly
Default genome assembly as a string or a assembly object. Default value is
assembly = "hg38".- linecolor
A character value or vector of character values specifying the line color(s) outlining the signal tracks. Default value is
linecolor = "#37a7db".- fill
A character value or vector specifying the fill color(s) of the signal tracks. Default value is
fill = NA.- ymax
A numeric specifying the fraction of the max y-value to set as the height of each plot. Default value is
ymax = 1.- range
A numeric vector of length 2 specifying the y-range of data to plot (c(min, max)) in each signal track. If
range = NULL, an optimal range for all signal tracks will be calculated.- scale
A logical value indicating whether to include a data scale label in the top left corner of each plot. Default value is
scale = FALSE.- label
An optional character vector to conveniently add text labels to signal tracks. If
scale = TRUE, the labels will be drawn in the top right of the signal tracks. Otherwise, the label will be drawn in the top left of the plot. For more customizable labels, use plotText.- bg
Character value indicating background color. Default value is
bg = NA.- baseline
Logical value indicating whether to include a baseline along the x-axis. Default value is
baseline = TRUE.- baseline.color
Baseline color. Default value is
baseline.color = "grey".- baseline.lwd
Baseline line width. Default value is
baseline.lwd = 1.- orientation
A string specifying signal track orientations. Default value is
orientation = "h". Options are:"v":Vertical signal track orientations, where signal tracks will be stacked from left to right.
"h":Horizontal signal track orientations, where signal tracks will be stacked from top to bottom.
- x
A numeric vector or unit object specifying the overall multisignal x-location.
- y
A numeric, unit object, or character containing a "b" combined with a numeric value specifying overall multisignal plot y-location. The character value will place the multisignal plot y relative to the bottom of the most recently plotted plot according to the units of the plotgardener page.
- width
A numeric or unit object specifying overall multisignal plot width.
- height
A numeric or unit object specifying overall multisignal plot height.
- just
Justification of overall multisignal plot relative to its (x, y) location. If there are two values, the first value specifies horizontal justification and the second value specifies vertical justification. Possible string values are:
"left","right","centre","center","bottom", and"top". Default value isjust = c("left", "top").- gapdistance
A numeric or unit object specifying space between plots. Default value is
gapdistance = 0.2.- default.units
A string indicating the default units to use if
xoryare only given as numerics. Default value isdefault.units = "inches".- draw
A logical value indicating whether graphics output should be produced. Default value
draw = TRUE.- params
An optional pgParams object containing relevant function parameters.
- ...
Additional grid graphical parameters. See gpar.
Value
Returns a list of signal objects containing relevant
genomic region, placement, and grob information for each signal
track.
Examples
library("plotgardenerData")
data("GM12878_ChIP_CTCF_signal")
data("IMR90_ChIP_CTCF_signal")
data("GM12878_ChIP_H3K27ac_signal")
data("IMR90_ChIP_H3K27ac_signal")
library("RColorBrewer")
## List of multiple signal datasets
signalList <- list(GM12878_ChIP_CTCF_signal, GM12878_ChIP_H3K27ac_signal,
IMR90_ChIP_CTCF_signal, IMR90_ChIP_H3K27ac_signal)
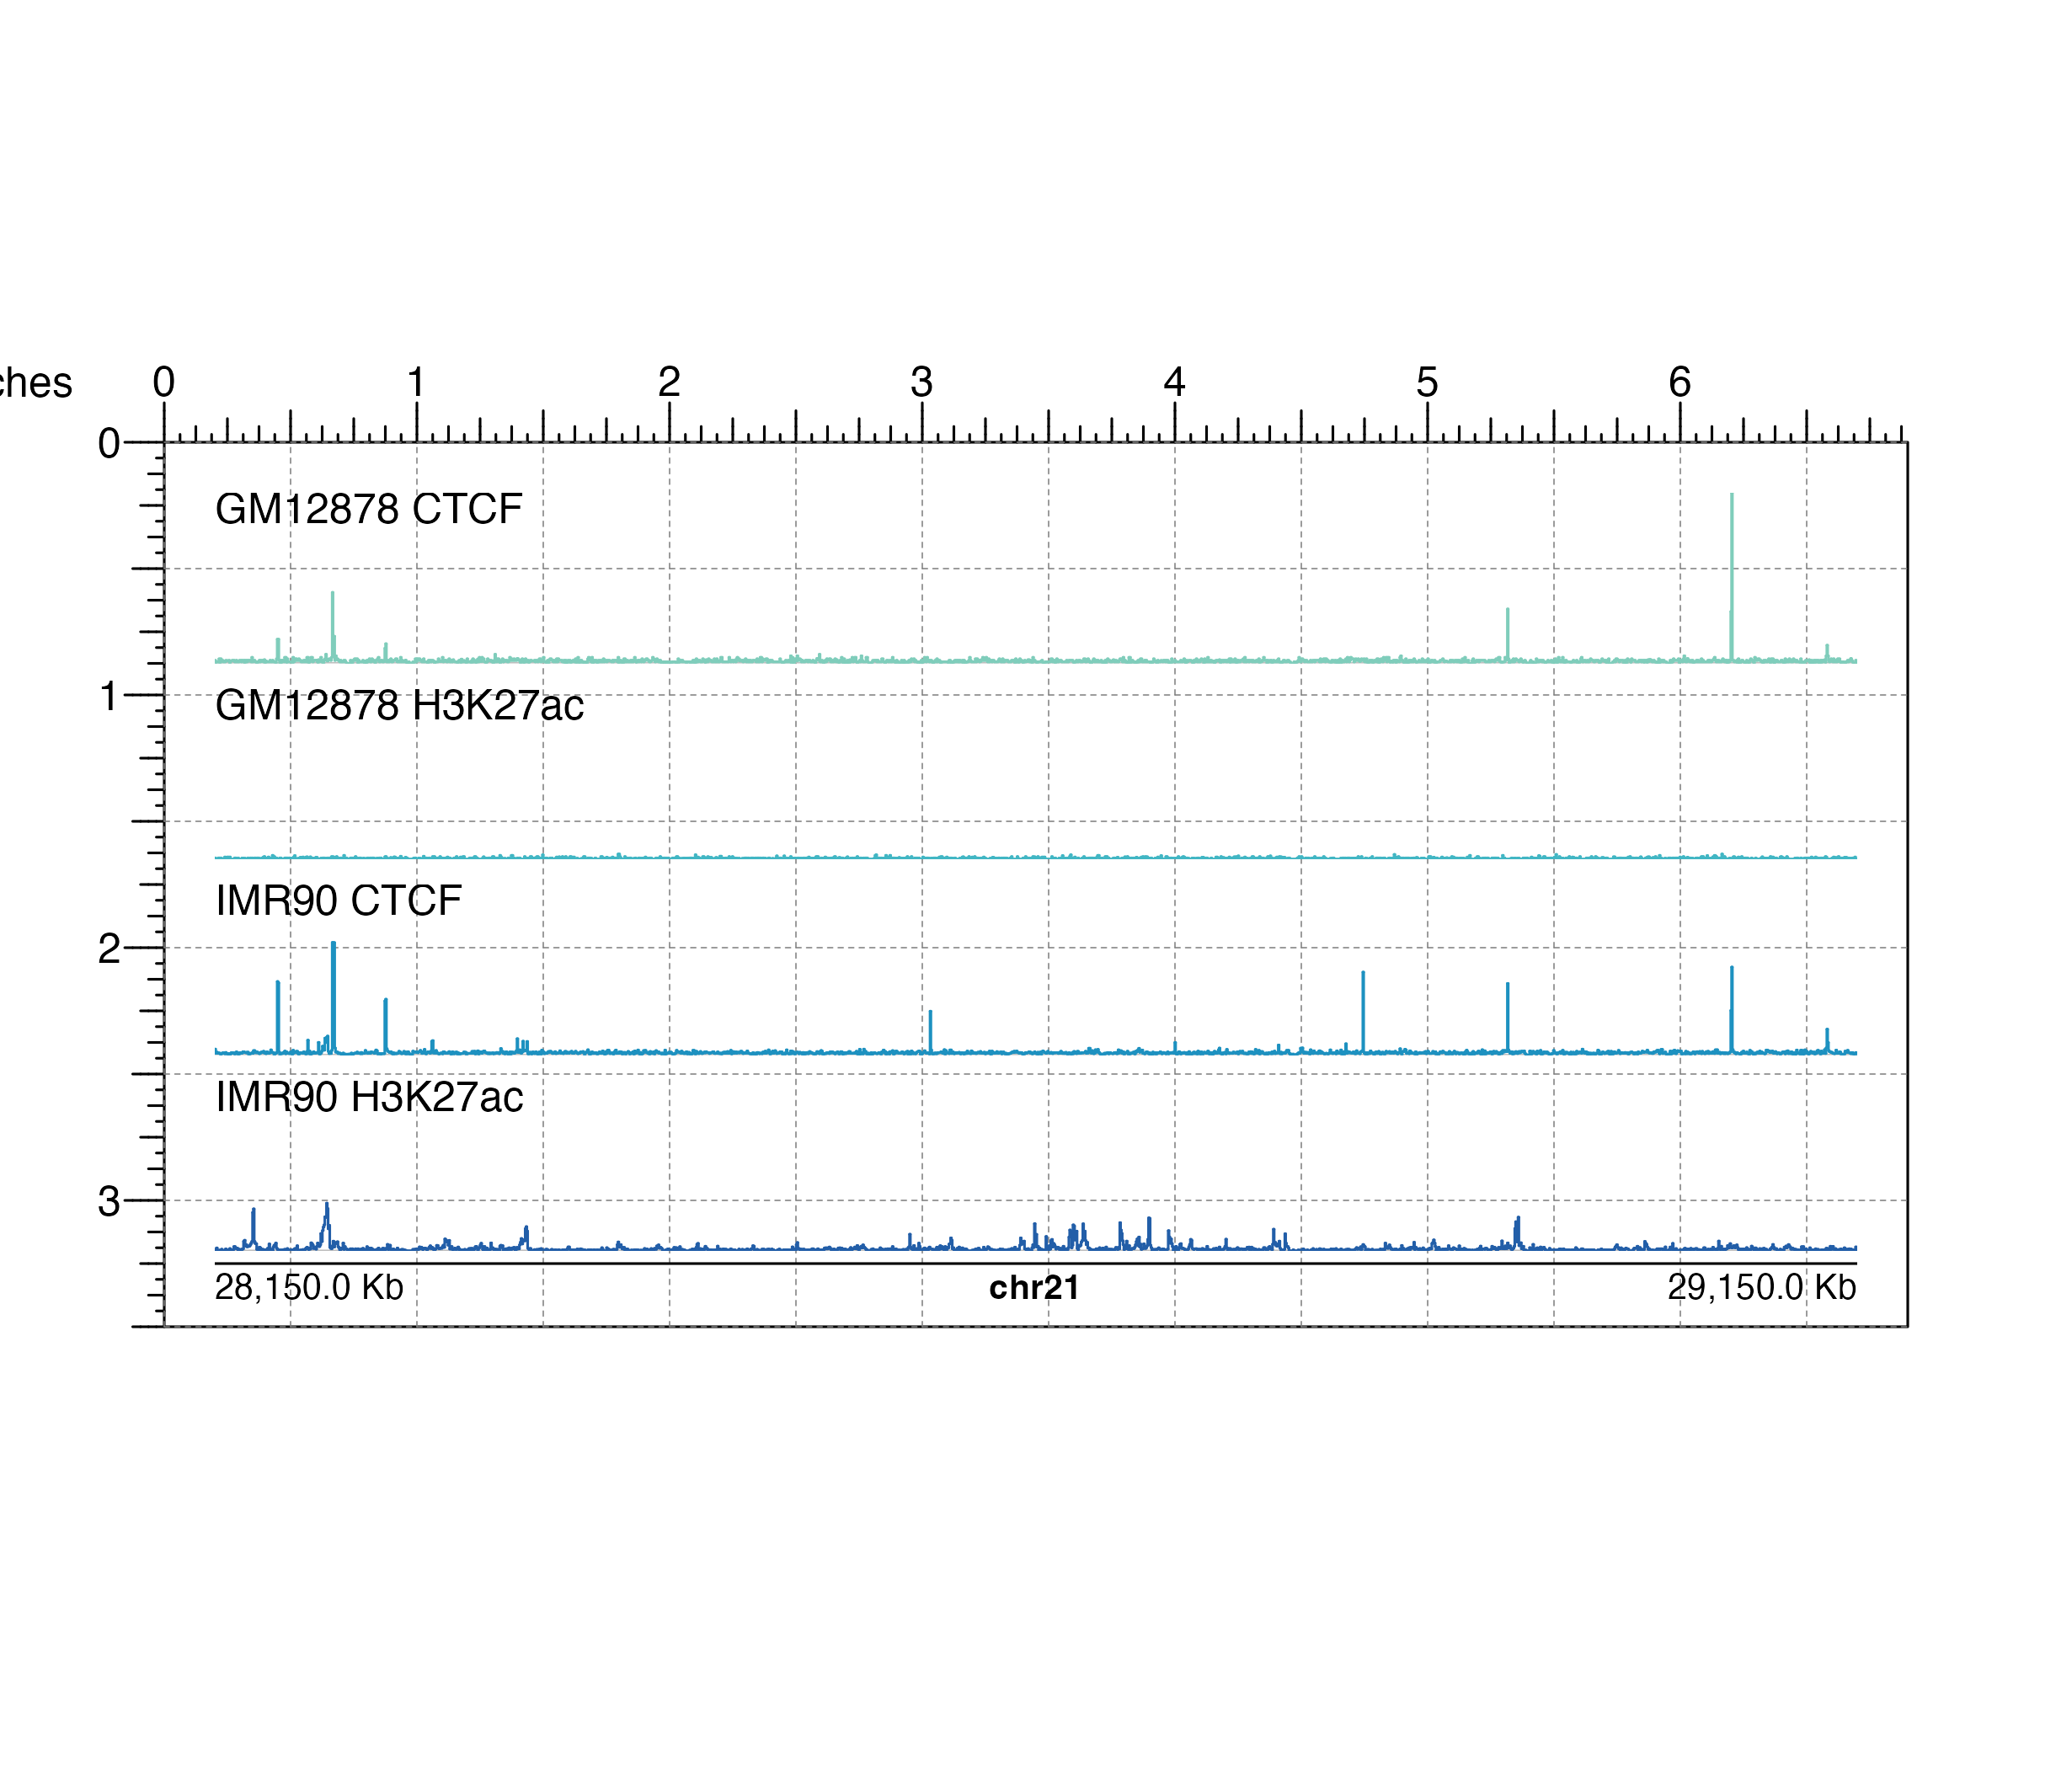
## Create page
pageCreate(width = 6.9, height = 3.5, default.units = "inches")
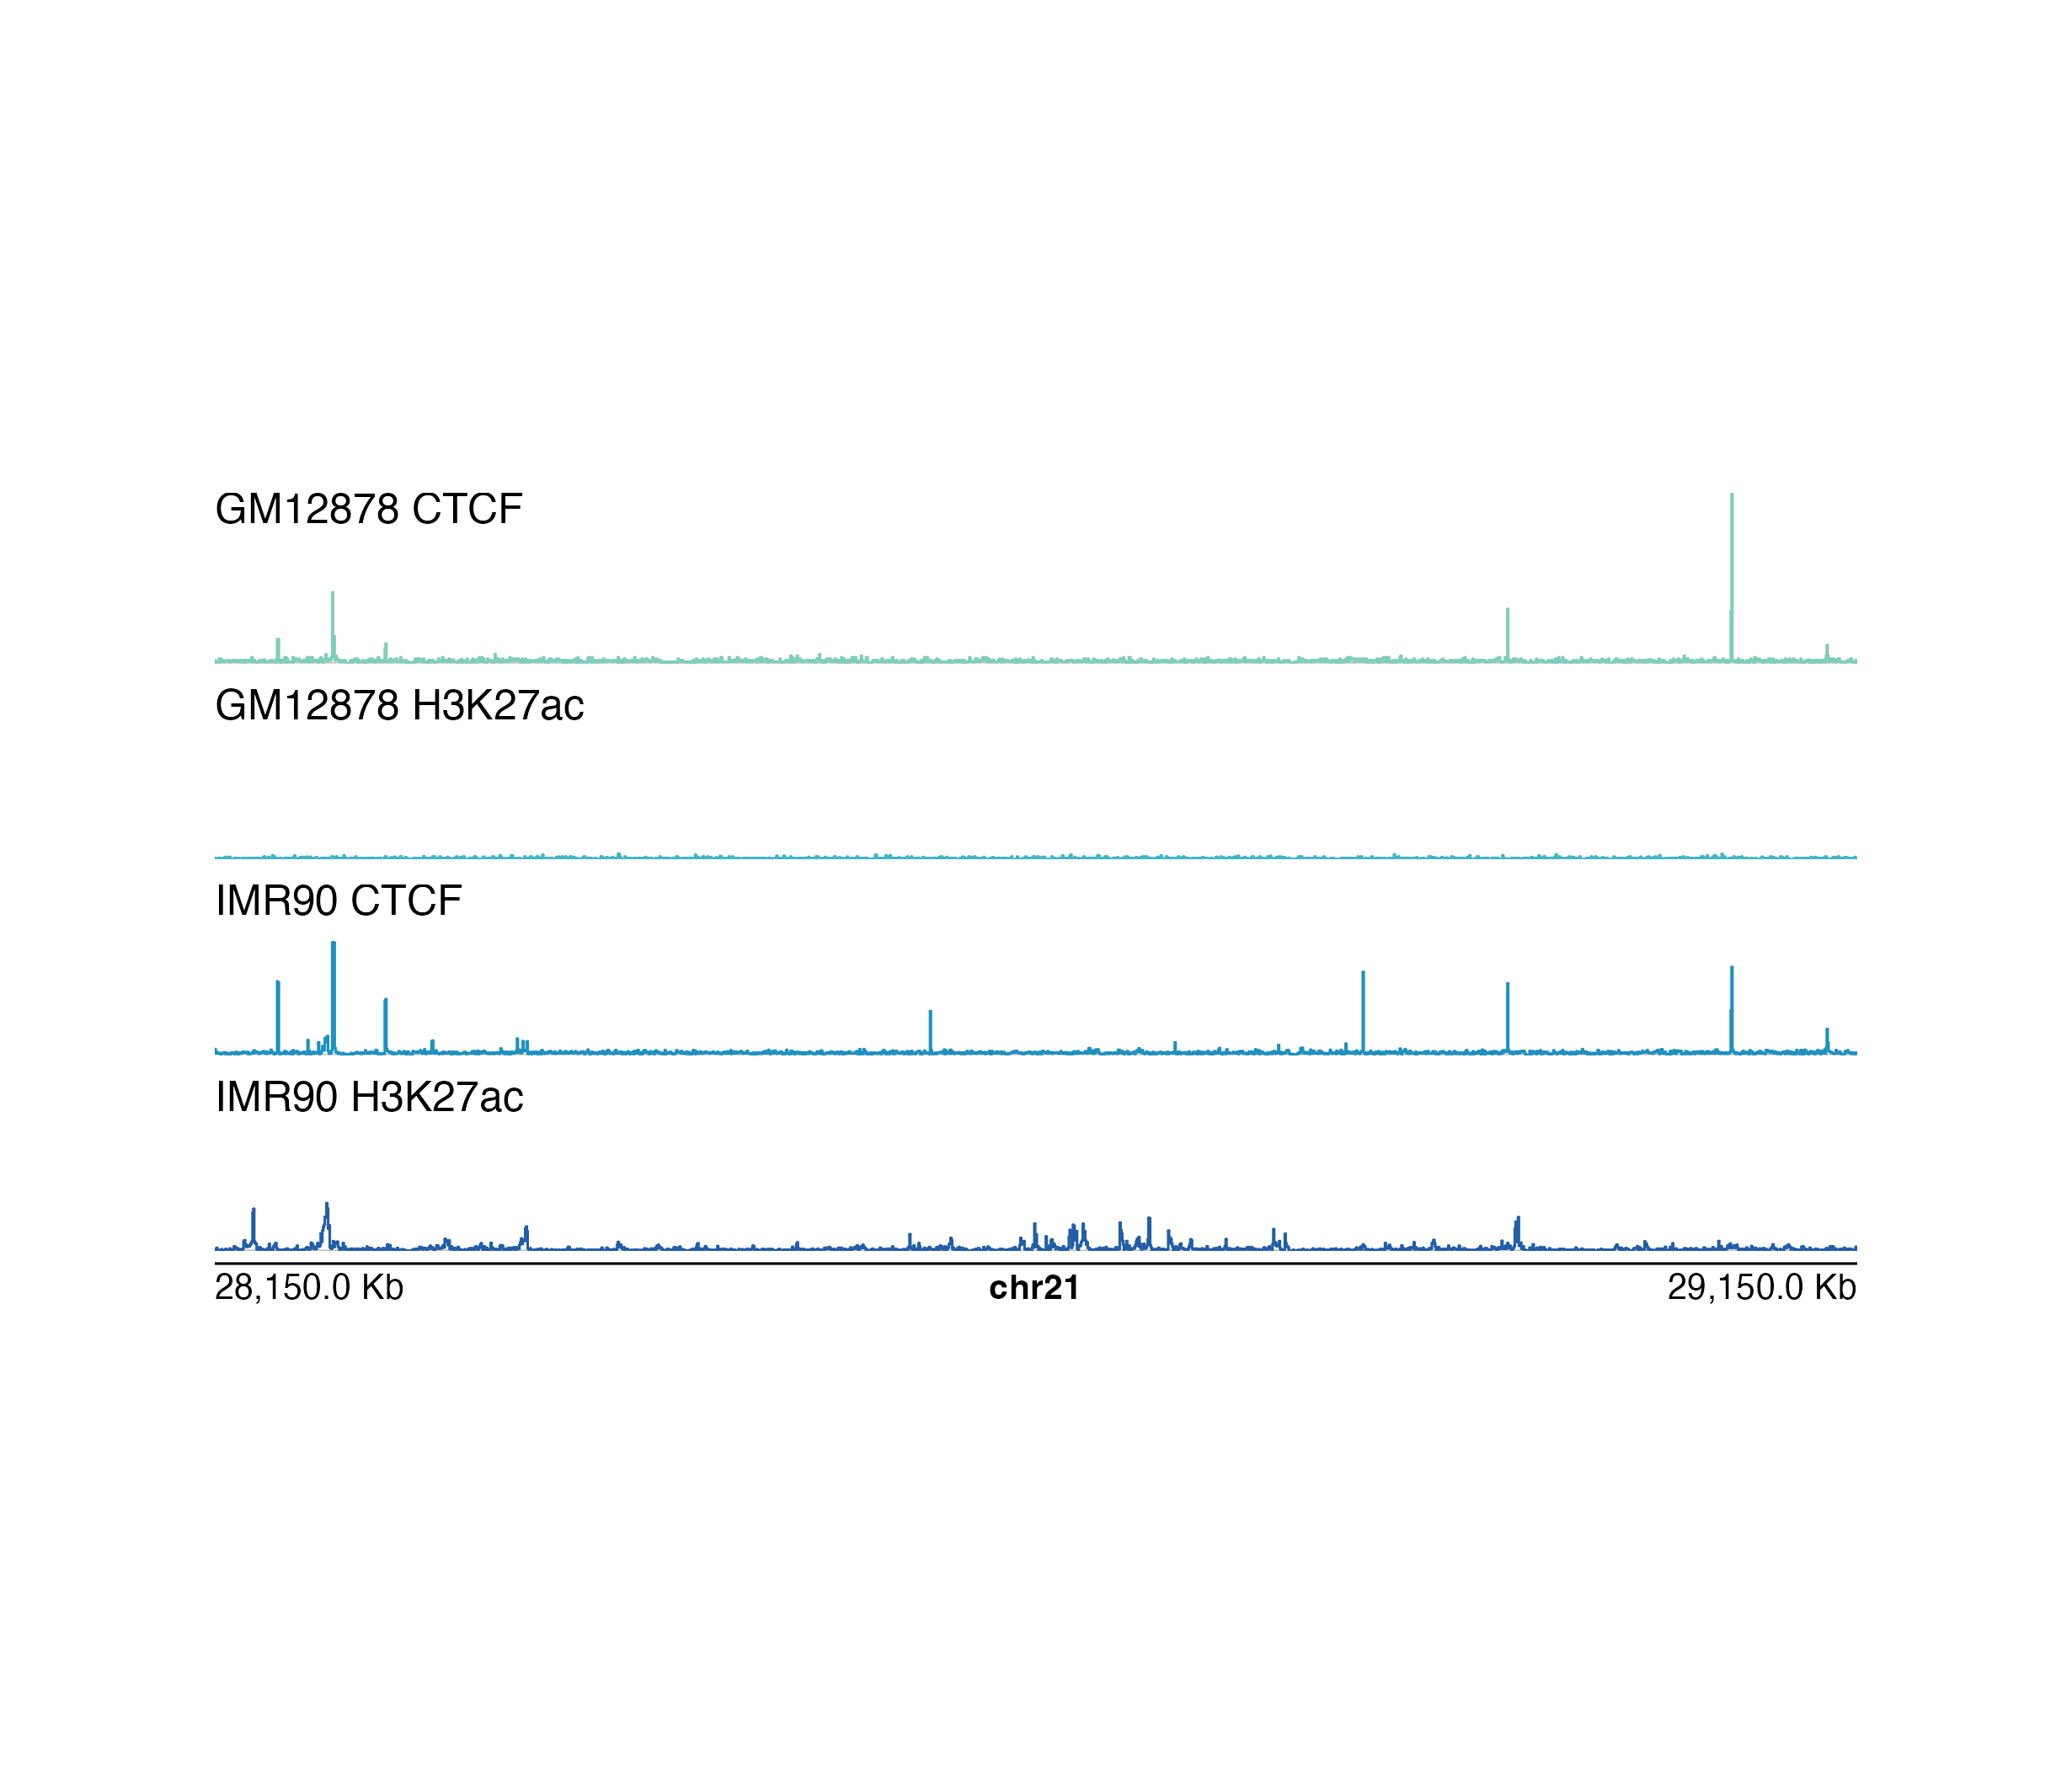
## Plot multiple signals
multisignal <- plotMultiSignal(signalList, chrom = "chr21",
chromstart = 28150000, chromend = 29150000,
linecolor = c(brewer.pal(n = 9,"YlGnBu")[4],
brewer.pal(n = 9,"YlGnBu")[5],
brewer.pal(n = 9,"YlGnBu")[6],
brewer.pal(n = 9,"YlGnBu")[7]),
label = c("GM12878 CTCF", "GM12878 H3K27ac",
"IMR90 CTCF", "IMR90 H3K27ac"),
assembly = "hg19",
x = 0.2, y = 0.2,
width = 6.5, height = 3,
default.units = "inches",
gapdistance = 0.1)
#> multisignal[multisignal1]
## Plot genome label
plotGenomeLabel(
chrom = "chr21",
chromstart = 28150000, chromend = 29150000,
assembly = "hg19",
scale = "Kb",
x = 0.2, y = 3.25, length = 6.5,
default.units = "inches"
)
 #> genomeLabel[genomeLabel1]
## Hide page guides
pageGuideHide()
#> genomeLabel[genomeLabel1]
## Hide page guides
pageGuideHide()