Plot a chromosome ideogram with or without cytobands
plotIdeogram(
    chrom,
    assembly = "hg38",
    data = NULL,
    orientation = "h",
    flip = FALSE,
    showBands = TRUE,
    fill = NULL,
    x = NULL,
    y = NULL,
    width = NULL,
    height = NULL,
    just = c("left", "top"),
    default.units = "inches",
    draw = TRUE,
    params = NULL
)
Arguments
- chrom
Chromosome to be plotted, as a string.
- assembly
Default genome assembly as a string or a assembly object. Default value is
assembly = "hg38".- data
Custom cytoband data, as a dataframe with the following columns: "seqnames", "start", "end", "width", "strand", "name", "gieStain".
- orientation
Character value indicating the orientation of the ideogram. Default value is
orientation = "h". Options are:"v":Vertical ideogram orientation.
"h":Horizontal ideogram orientation.
- flip
Logical value indicating whether to reverse the start and end positions of the ideogram. If
flip = FALSE(default), the ideogram starts at the top/left and ends at the bottom/right. Ifflip = TRUE, the start and end positions are reversed, meaning the ideogram starts at the bottom/right and ends at the top/left.- showBands
Logical value indicating whether to draw colored cytobands within ideogram. Default value is
showBands = TRUE.- fill
(optional) A vector specifying alternate colors for cytoband stains. To change specific gieStain values (i.e. gneg, gpos, etc.) to specific colors, this vector can be named. This vector must have the same number of colors as there are gieStain values for each genome assembly.
- x
A numeric or unit object specifying ideogram x-location.
- y
A numeric, unit object, or character containing a "b" combined with a numeric value specifying ideogram y-location. The character value will place the ideogram y relative to the bottom of the most recently plotted plot according to the units of the plotgardener page.
- width
A numeric or unit object specifying ideogram width.
- height
A numeric or unit object specifying ideogram height.
- just
Justification of ideogram relative to its (x, y) location. If there are two values, the first value specifies horizontal justification and the second value specifies vertical justification. Possible string values are:
"left","right","centre","center","bottom", and"top". Default value isjust = c("left", "top").- default.units
A string indicating the default units to use if
x,y,width, orheightare only given as numerics. Default value isdefault.units = "inches".- draw
A logical value indicating whether graphics output should be produced. Default value is
draw = TRUE.- params
An optional pgParams object containing relevant function parameters.
Value
Returns a ideogram object containing relevant
genomic region, placement, and grob information.
Details
An ideogram can be placed on a plotgardener coordinate page by providing plot placement parameters:
plotIdeogram(chrom,
                x, y, width, height, just = c("left", "top"),
                default.units = "inches")
This function can also be used to quickly plot an unannotated ideogram by ignoring plot placement parameters:
plotIdeogram(chrom)If no data is provided, Giemsa stain band data will first try to fetch UCSC with AnnotationHub. The results are cached for faster access, but these cached items can be deleted. If no internet connection is available and AnnotationHub has not previously cached the data, custom Giemsa stain band data can be loaded with the `data` parameter.
See also
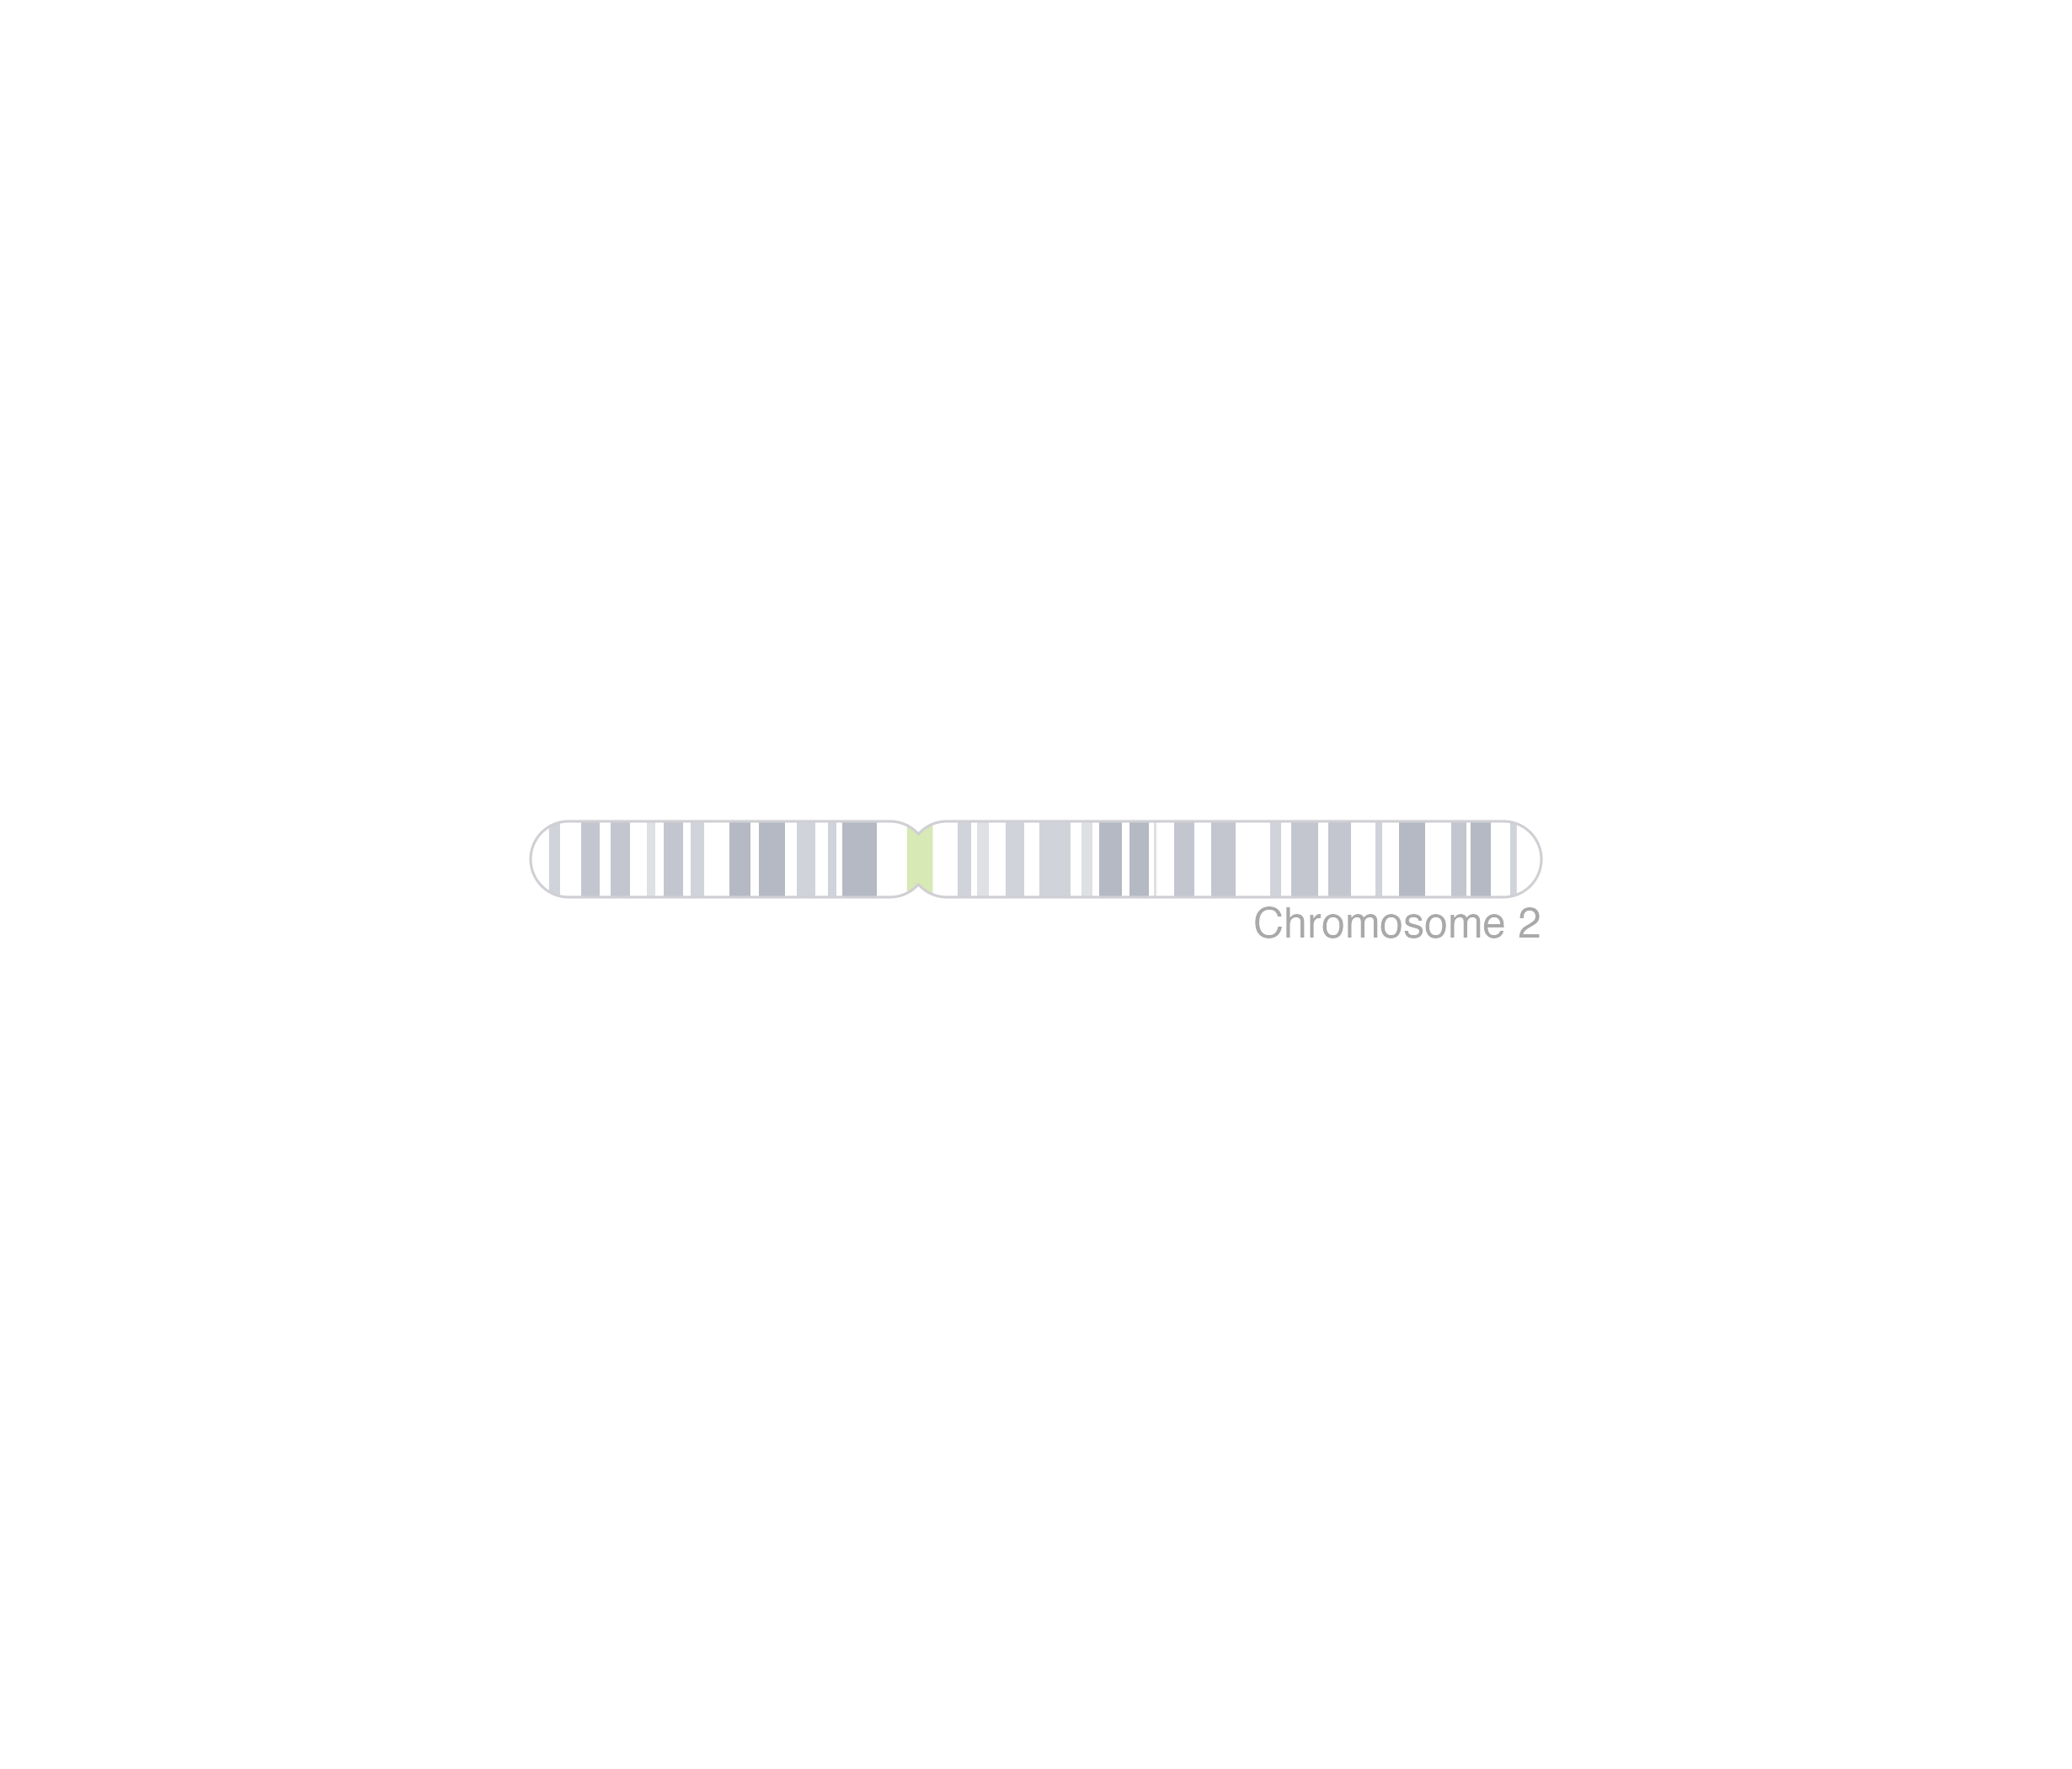
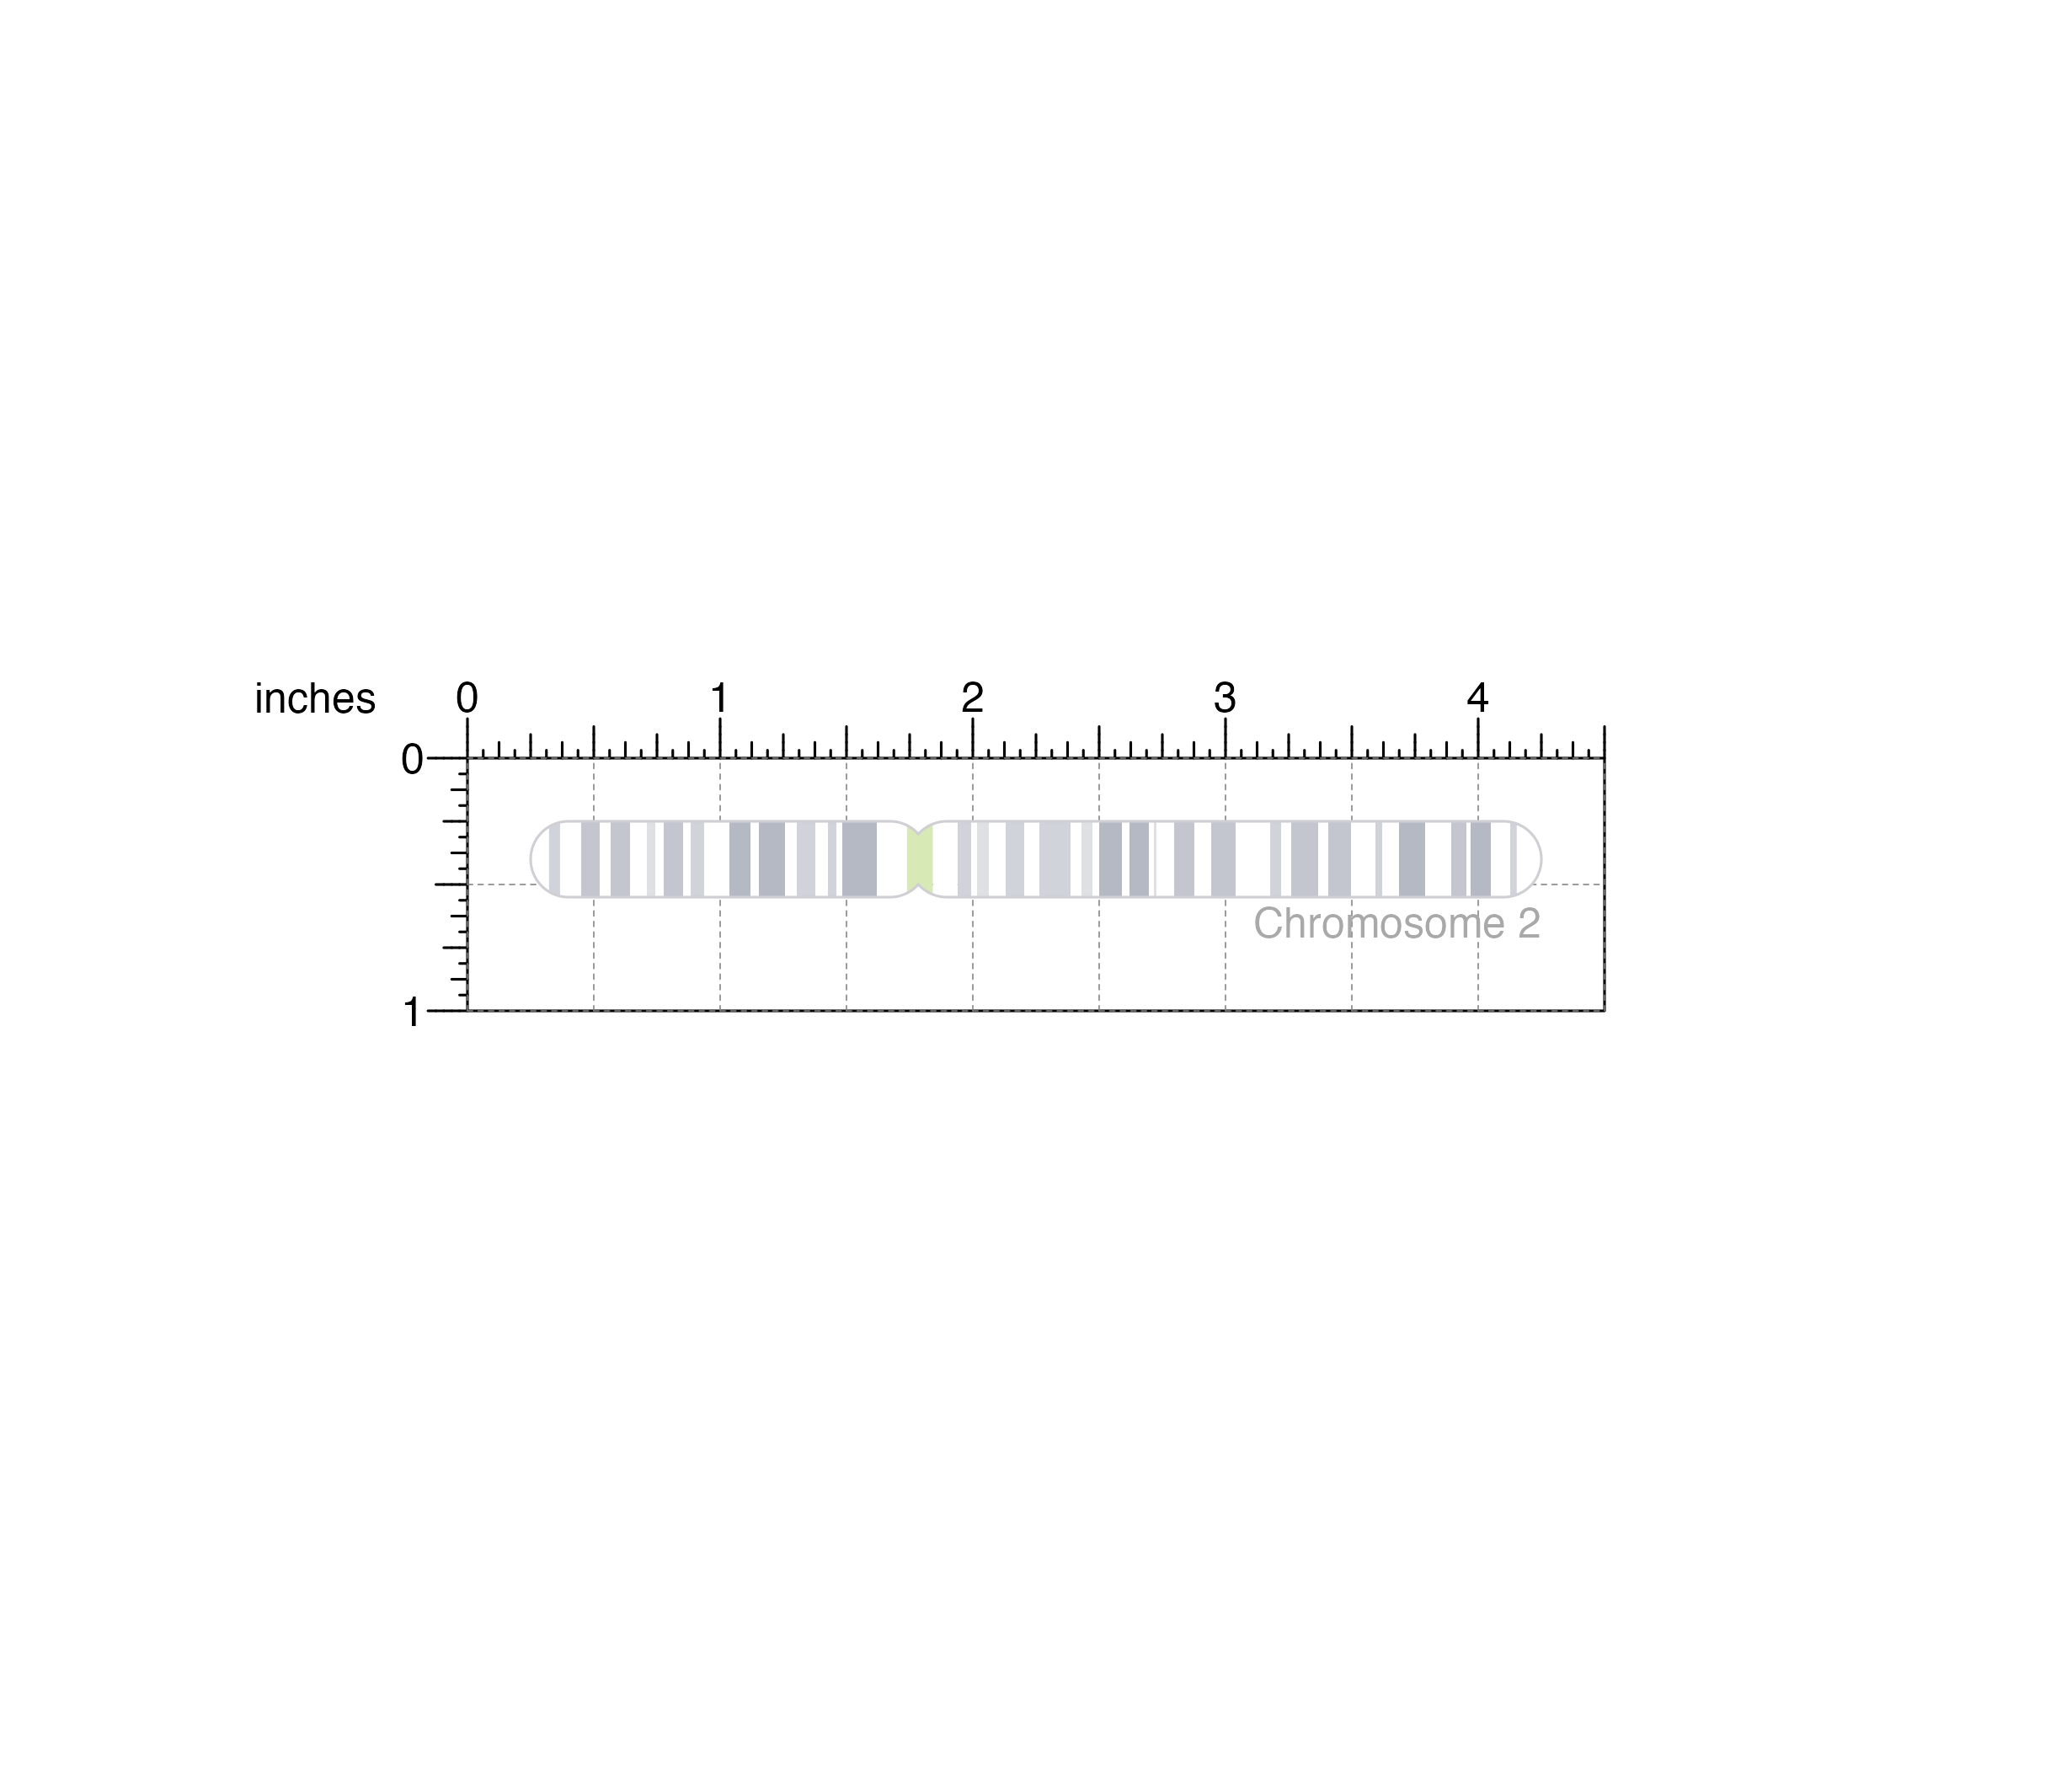
Examples
## Load Giemsa stain band information and genomic
## annotation data for hg19 genome assembly
library(TxDb.Hsapiens.UCSC.hg19.knownGene)
library(AnnotationHub)

## Create page
pageCreate(width = 4.5, height = 1, default.units = "inches")

## Plot and place ideogram
ideogramPlot <- plotIdeogram(
    chrom = "chr2", assembly = "hg19",
    x = 0.25, y = 0.25, width = 4, height = 0.3,
    just = c("left", "top"),
    default.units = "inches"
)
#> ideogram[ideogram1]

## Plot text
plotText(
    label = "Chromosome 2", fontcolor = "dark grey",
    x = 4.25, y = 0.65, just = "right"
)

#> text[text1]

## Hide page guides
pageGuideHide()
#> text[text1]
## Hide page guides
pageGuideHide()