Place a plot that has been previously created but not drawn
Source:R/pagePlotPlace.R
pagePlotPlace.RdPlace a plot that has been previously created but not drawn
pagePlotPlace(
    plot,
    x = NULL,
    y = NULL,
    width = NULL,
    height = NULL,
    just = c("left", "top"),
    default.units = "inches",
    draw = TRUE,
    params = NULL
)
Arguments
- plot
Plot object to be placed, defined by the output of a plotgardener plotting function.
- x
A numeric or unit object specifying plot x-location.
- y
A numeric, unit object, or character containing a "b" combined with a numeric value specifying plot y-location. The character value will place the plot y relative to the bottom of the most recently plotted plot according to the units of the plotgardener page.
- width
A numeric or unit object specifying plot width.
- height
A numeric or unit object specifying plot height.
- just
Justification of plot relative to its (x, y) location. If there are two values, the first value specifies horizontal justification and the second value specifies vertical justification. Possible string values are:
"left","right","centre","center","bottom", and"top". Default value isjust = c("left", "top").- default.units
A string indicating the default units to use if
x,y,width, orheightare only given as numerics. Default value isdefault.units = "inches".- draw
A logical value indicating whether graphics output should be produced. Default value is
draw = TRUE.- params
An optional pgParams object containing relevant function parameters.
Value
Function will update dimensions of an input plot and return an updated plot object.
Examples
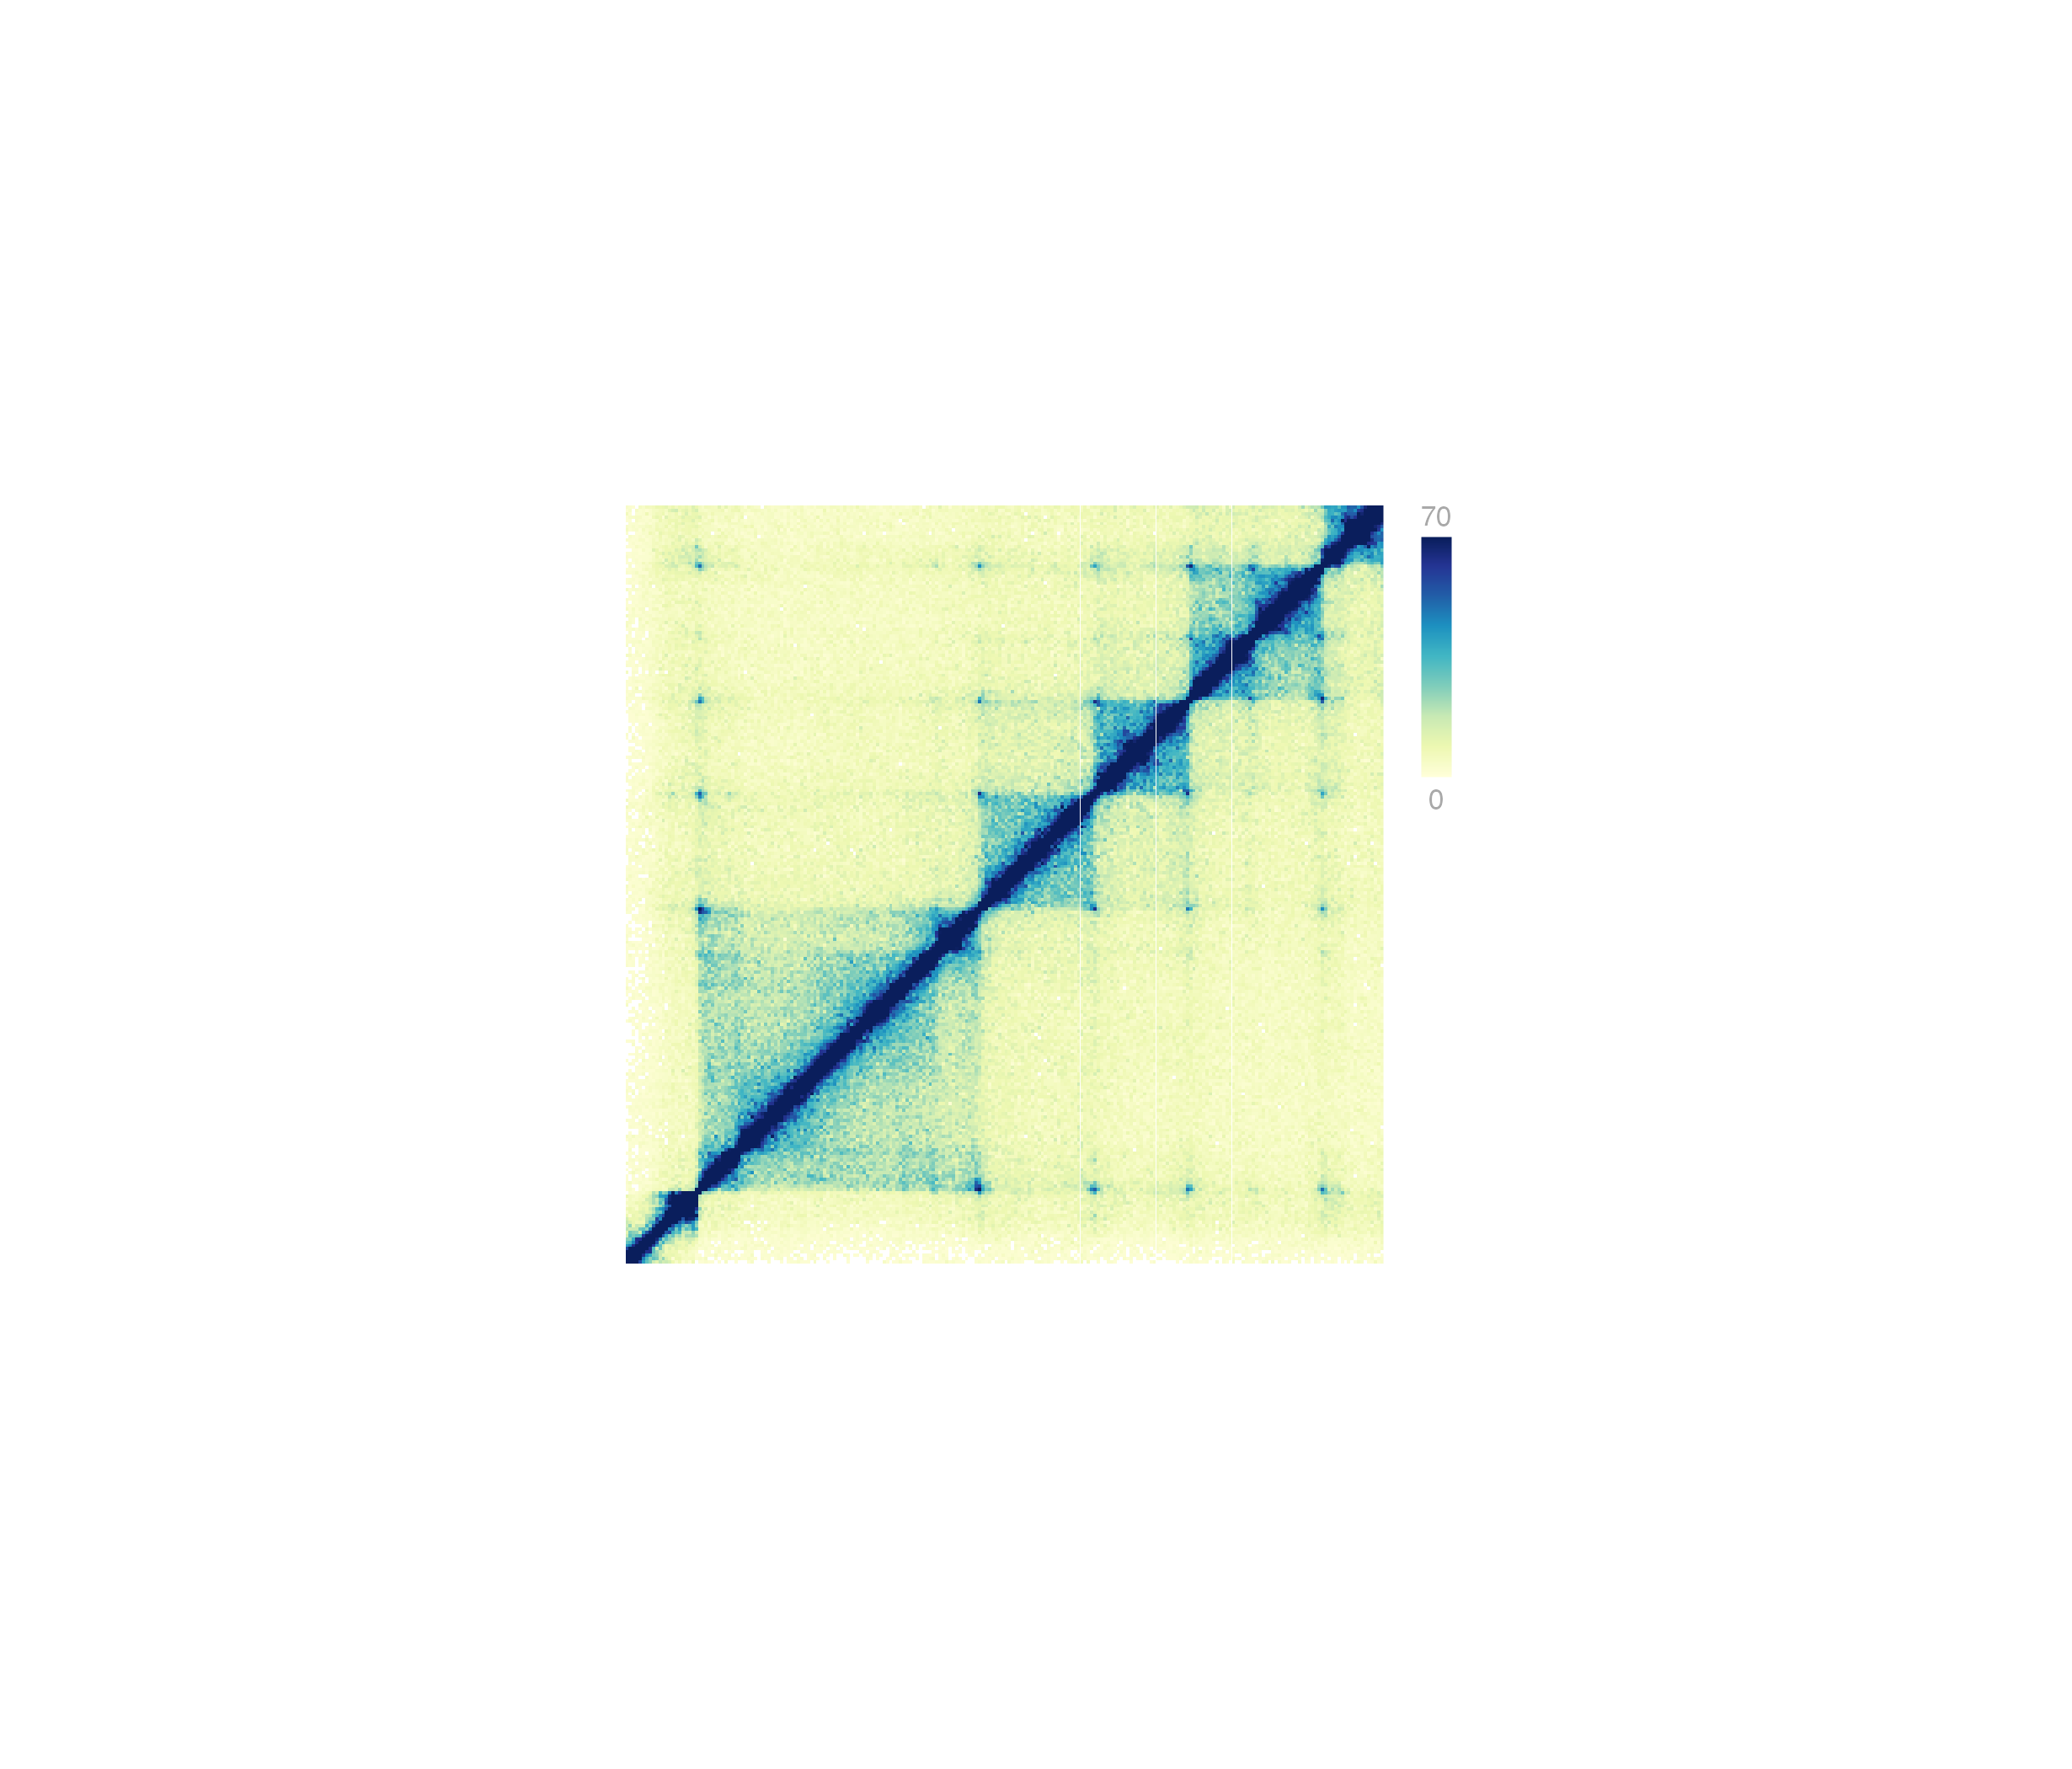
## Load Hi-C data
library(plotgardenerData)
data("IMR90_HiC_10kb")

## Create, but do not plot, square Hi-C plot
hicPlot <- plotHicSquare(
    data = IMR90_HiC_10kb, resolution = 10000,
    zrange = c(0, 70),
    chrom = "chr21",
    chromstart = 28000000, chromend = 30300000,
    draw = FALSE
)
#> Read in dataframe.  Assuming 'chrom' in column1 and 'altchrom' in column2. 10000 BP resolution detected.
#> hicSquare[hicSquare1]

## Create page
pageCreate(width = 3.75, height = 3.5, default.units = "inches")

## Place Hi-C plot on page
pagePlotPlace(
    plot = hicPlot,
    x = 0.25, y = 0.25, width = 3, height = 3,
    just = c("left", "top"),
    default.units = "inches", draw = TRUE
)
#> hicSquare[hicSquare1]

## Annotate heatmap legend
annoHeatmapLegend(
    plot = hicPlot,
    x = 3.4, y = 0.25, width = 0.12, height = 1.2,
    just = c("left", "top"), default.units = "inches"
)

#> heatmapLegend[heatmapLegend1]

## Hide page guides
pageGuideHide()
#> heatmapLegend[heatmapLegend1]
## Hide page guides
pageGuideHide()