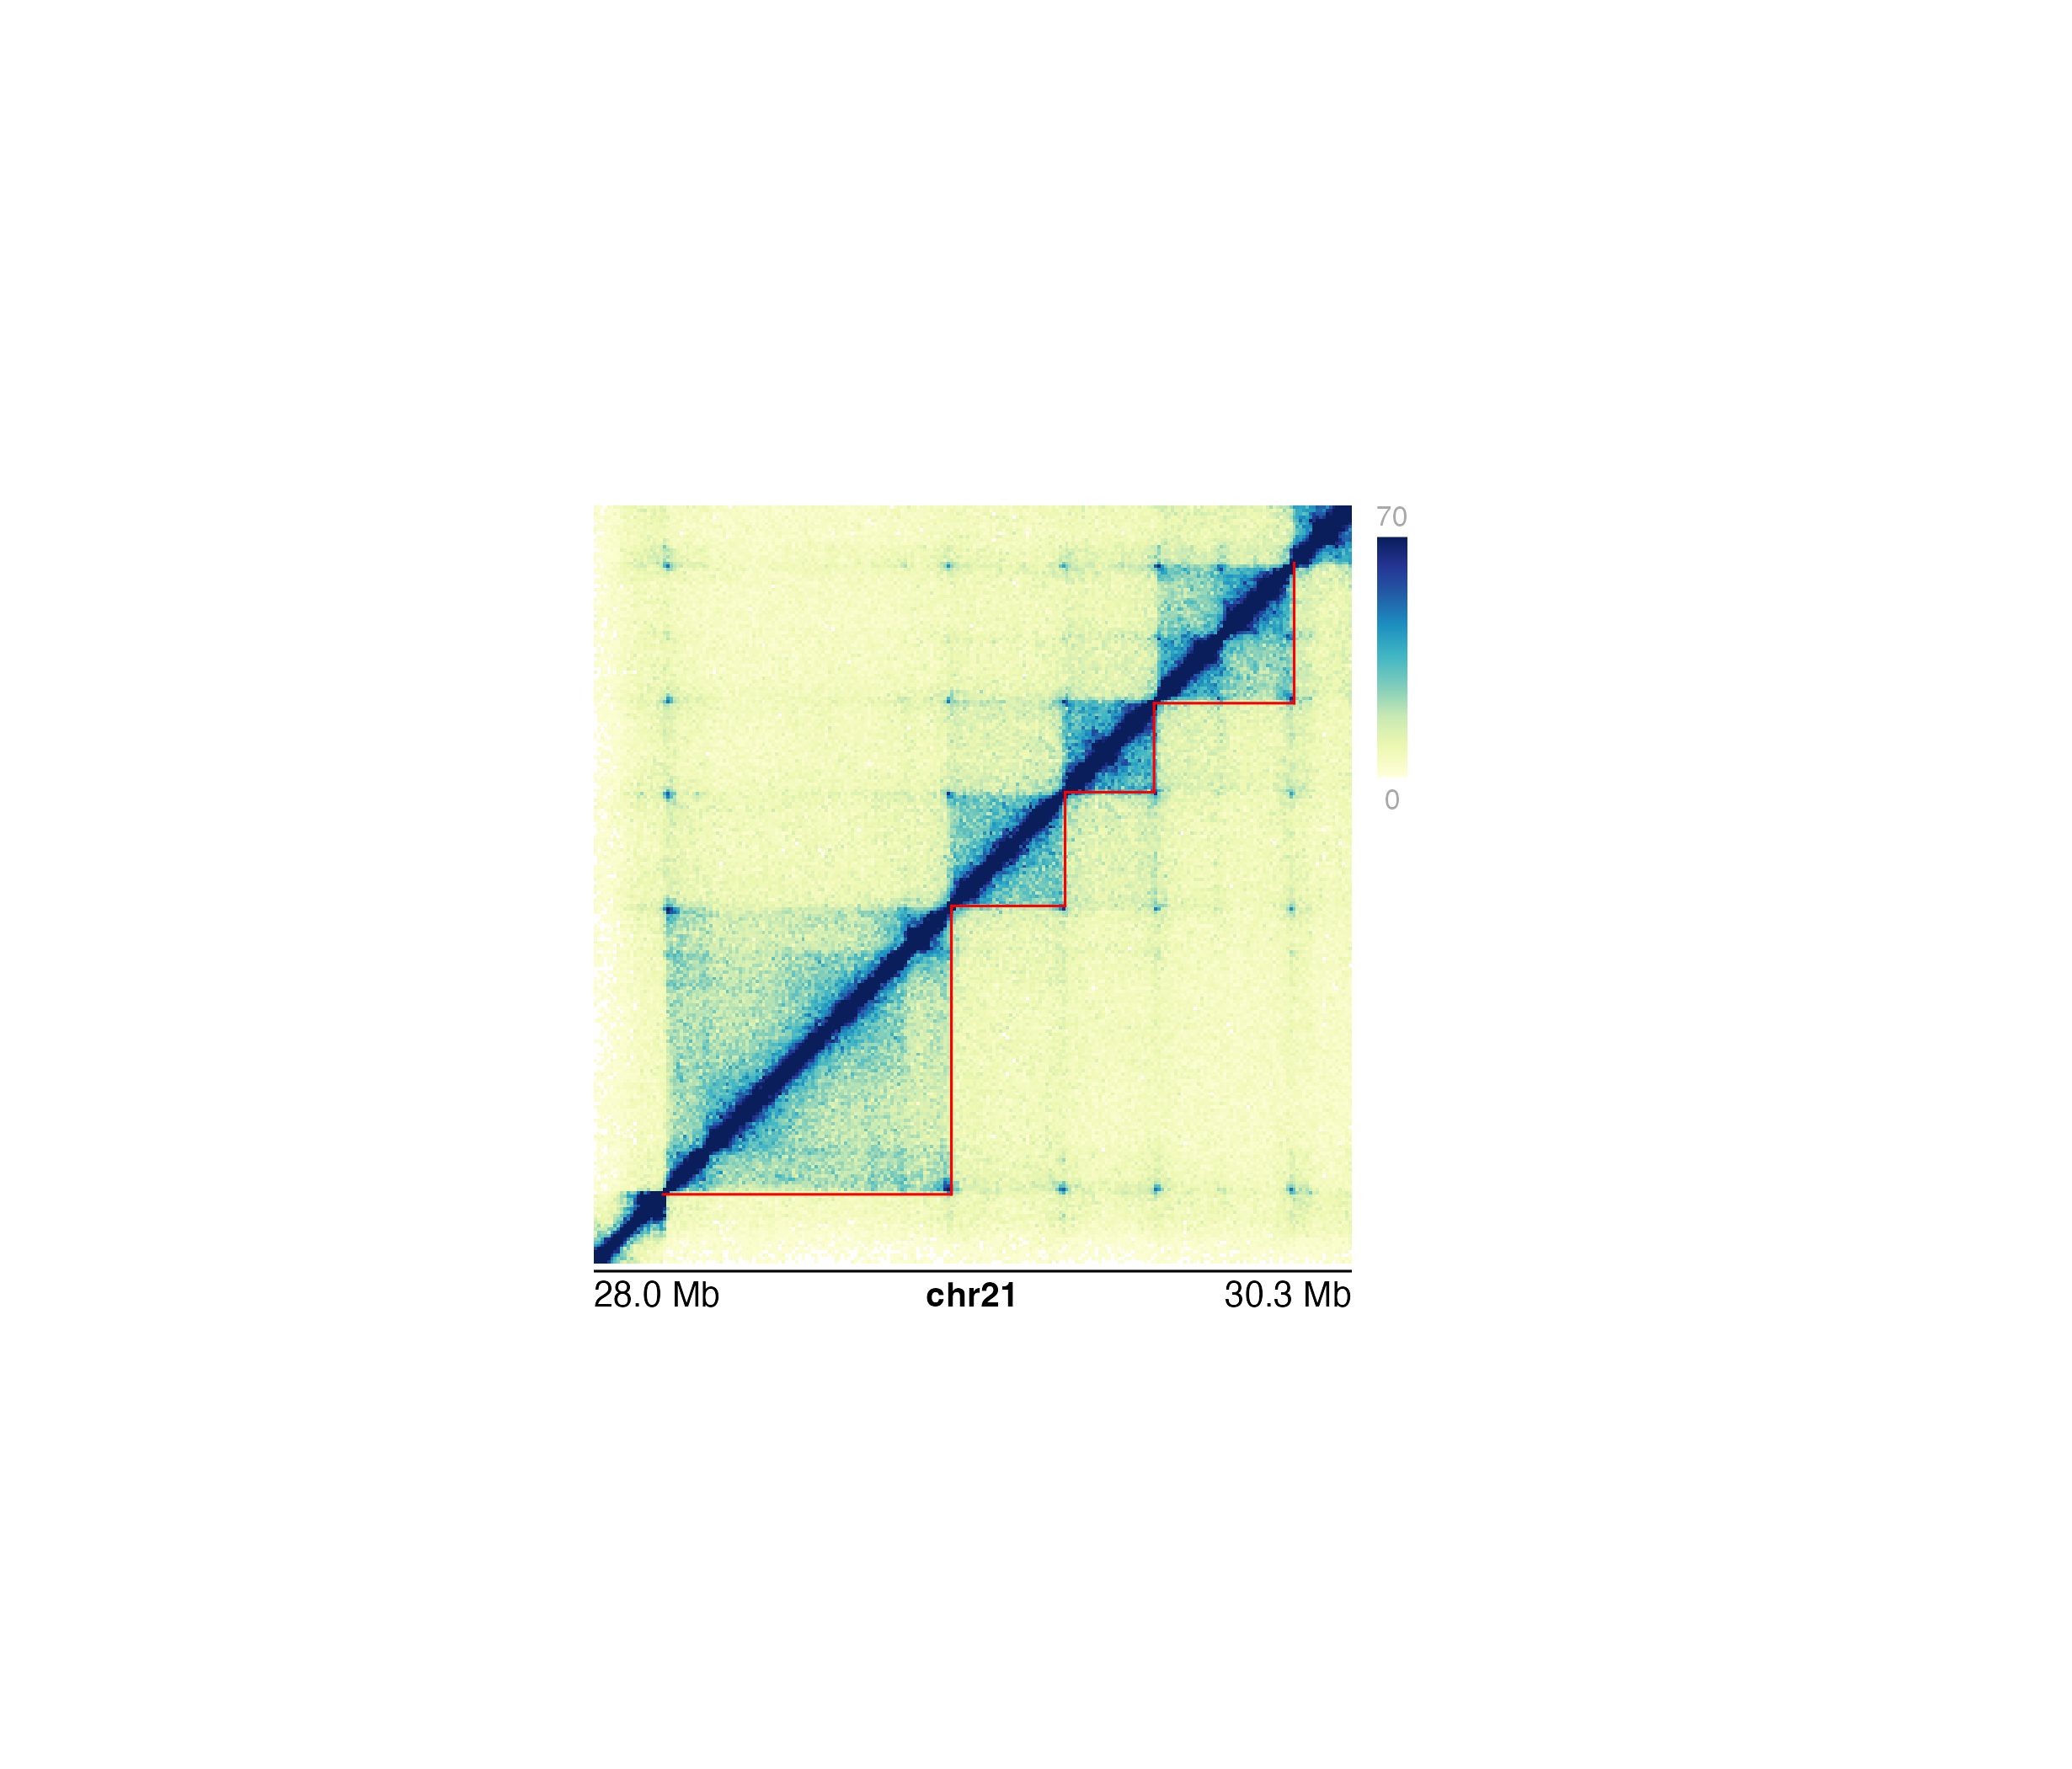
Annotate domains in a Hi-C plot
annoDomains(
    plot,
    data,
    half = "inherit",
    linecolor = "black",
    params = NULL,
    ...
)
Arguments
- plot
Hi-C plot object from
plotHicSquareorplotHicTriangleon which to annotate pixels.- data
A string specifying the BED file path, a dataframe in BED format, or a GRanges object specifying domain ranges.
- half
Character value specifying which half of hic plots to annotate. Triangle Hi-C plots will always default to the entirety of the triangular plot. Default value is
half = "inherit". Options are:"inherit":Domains will be annotated on the
halfinherited by the input Hi-C plot."both":Domains will be annotated on both halves of the diagonal of a square Hi-C plot.
"top":Domains will be annotated on the upper diagonal half of a square Hi-C plot.
"bottom":Domains will be annotated ont the bottom diagonal half of a square Hi-C plot.
- linecolor
A character value specifying the color of the domain annotations. Default value is
linecolor = "black".- params
An optional pgParams object containing relevant function parameters.
- ...
Additional grid graphical parameters. See gpar.
Value
Returns a domain object containing relevant
genomic region, placement, and grob information.
Examples
## Define a GRanges object with TAD ranges
library(GenomicRanges)
#> Loading required package: stats4
#> Loading required package: BiocGenerics
#>
#> Attaching package: ‘BiocGenerics’
#> The following objects are masked from ‘package:stats’:
#>
#>     IQR, mad, sd, var, xtabs
#> The following objects are masked from ‘package:base’:
#>
#>     Filter, Find, Map, Position, Reduce, anyDuplicated, aperm, append,
#>     as.data.frame, basename, cbind, colnames, dirname, do.call,
#>     duplicated, eval, evalq, get, grep, grepl, intersect, is.unsorted,
#>     lapply, mapply, match, mget, order, paste, pmax, pmax.int, pmin,
#>     pmin.int, rank, rbind, rownames, sapply, saveRDS, setdiff, table,
#>     tapply, union, unique, unsplit, which.max, which.min
#> Loading required package: S4Vectors
#>
#> Attaching package: ‘S4Vectors’
#> The following object is masked from ‘package:utils’:
#>
#>     findMatches
#> The following objects are masked from ‘package:base’:
#>
#>     I, expand.grid, unname
#> Loading required package: IRanges
#> Loading required package: GenomeInfoDb
library(IRanges)
domains <- GRanges("chr21",
    ranges = IRanges(
        start = c(28210000, 29085000, 29430000, 29700000),
        end = c(29085000, 29430000, 29700000, 30125000)
    )
)

## Load Hi-C data
library(plotgardenerData)
data("IMR90_HiC_10kb")

## Create page
pageCreate(width = 4.5, height = 4, default.units = "inches")

## Plot and place a square Hi-C plot
hicPlot <- plotHicSquare(
    data = IMR90_HiC_10kb, resolution = 10000,
    zrange = c(0, 70),
    chrom = "chr21",
    chromstart = 28000000, chromend = 30300000,
    assembly = "hg19",
    x = 0.5, y = 0.5, width = 3, height = 3,
    just = c("left", "top"),
    default.units = "inches"
)
#> Read in dataframe.  Assuming 'chrom' in column1 and 'altchrom' in column2. 10000 BP resolution detected.
#> hicSquare[hicSquare1]

## Annotate domains on bottom half 0f Hi-C plot
annoDomains(
    plot = hicPlot, data = domains,
    half = "bottom", linecolor = "red"
)
#> domain[domain1]

## Annotate heatmap legend
annoHeatmapLegend(
    plot = hicPlot,
    x = 3.6, y = 0.5, width = 0.12, height = 1.2,
    just = c("left", "top"), default.units = "inches"
)
#> heatmapLegend[heatmapLegend1]

## Annotate genome label
annoGenomeLabel(
    plot = hicPlot, x = 0.5, y = 3.53, scale = "Mb",
    just = c("left", "top")
)

#> genomeLabel[genomeLabel1]

## Hide page guides
pageGuideHide()
#> genomeLabel[genomeLabel1]
## Hide page guides
pageGuideHide()