Plot a ggplot2 plot, gtable, or grob object in a plotgardener layout
plotGG(
    plot,
    x,
    y,
    width,
    height,
    just = c("left", "top"),
    default.units = "inches",
    params = NULL
)
Arguments
- plot
ggplot, gtable, or grob object.
- x
A numeric or unit object specifying ggplot x-location.
- y
A numeric, unit object, or character containing a "b" combined with a numeric value specifying ggplot y-location. The character value will place the ggplot y relative to the bottom of the most recently plotted plot according to the units of the plotgardener page.
- width
A numeric or unit object specifying ggplot width.
- height
A numeric or unit object specifying ggplot height.
- just
Justification of ggplot relative to its (x, y) location. If there are two values, the first value specifies horizontal justification and the second value specifies vertical justification. Possible string values are:
"left","right","centre","center","bottom", and"top". Default value isjust = c("left", "top").- default.units
A string indicating the default units to use if
x,y,width, orheightare only given as numerics. Default value isdefault.units = "inches".- params
An optional pgParams object containing relevant function parameters.
Value
Returns a pg_gg object containing
relevant placement and grob information.
See also
Examples
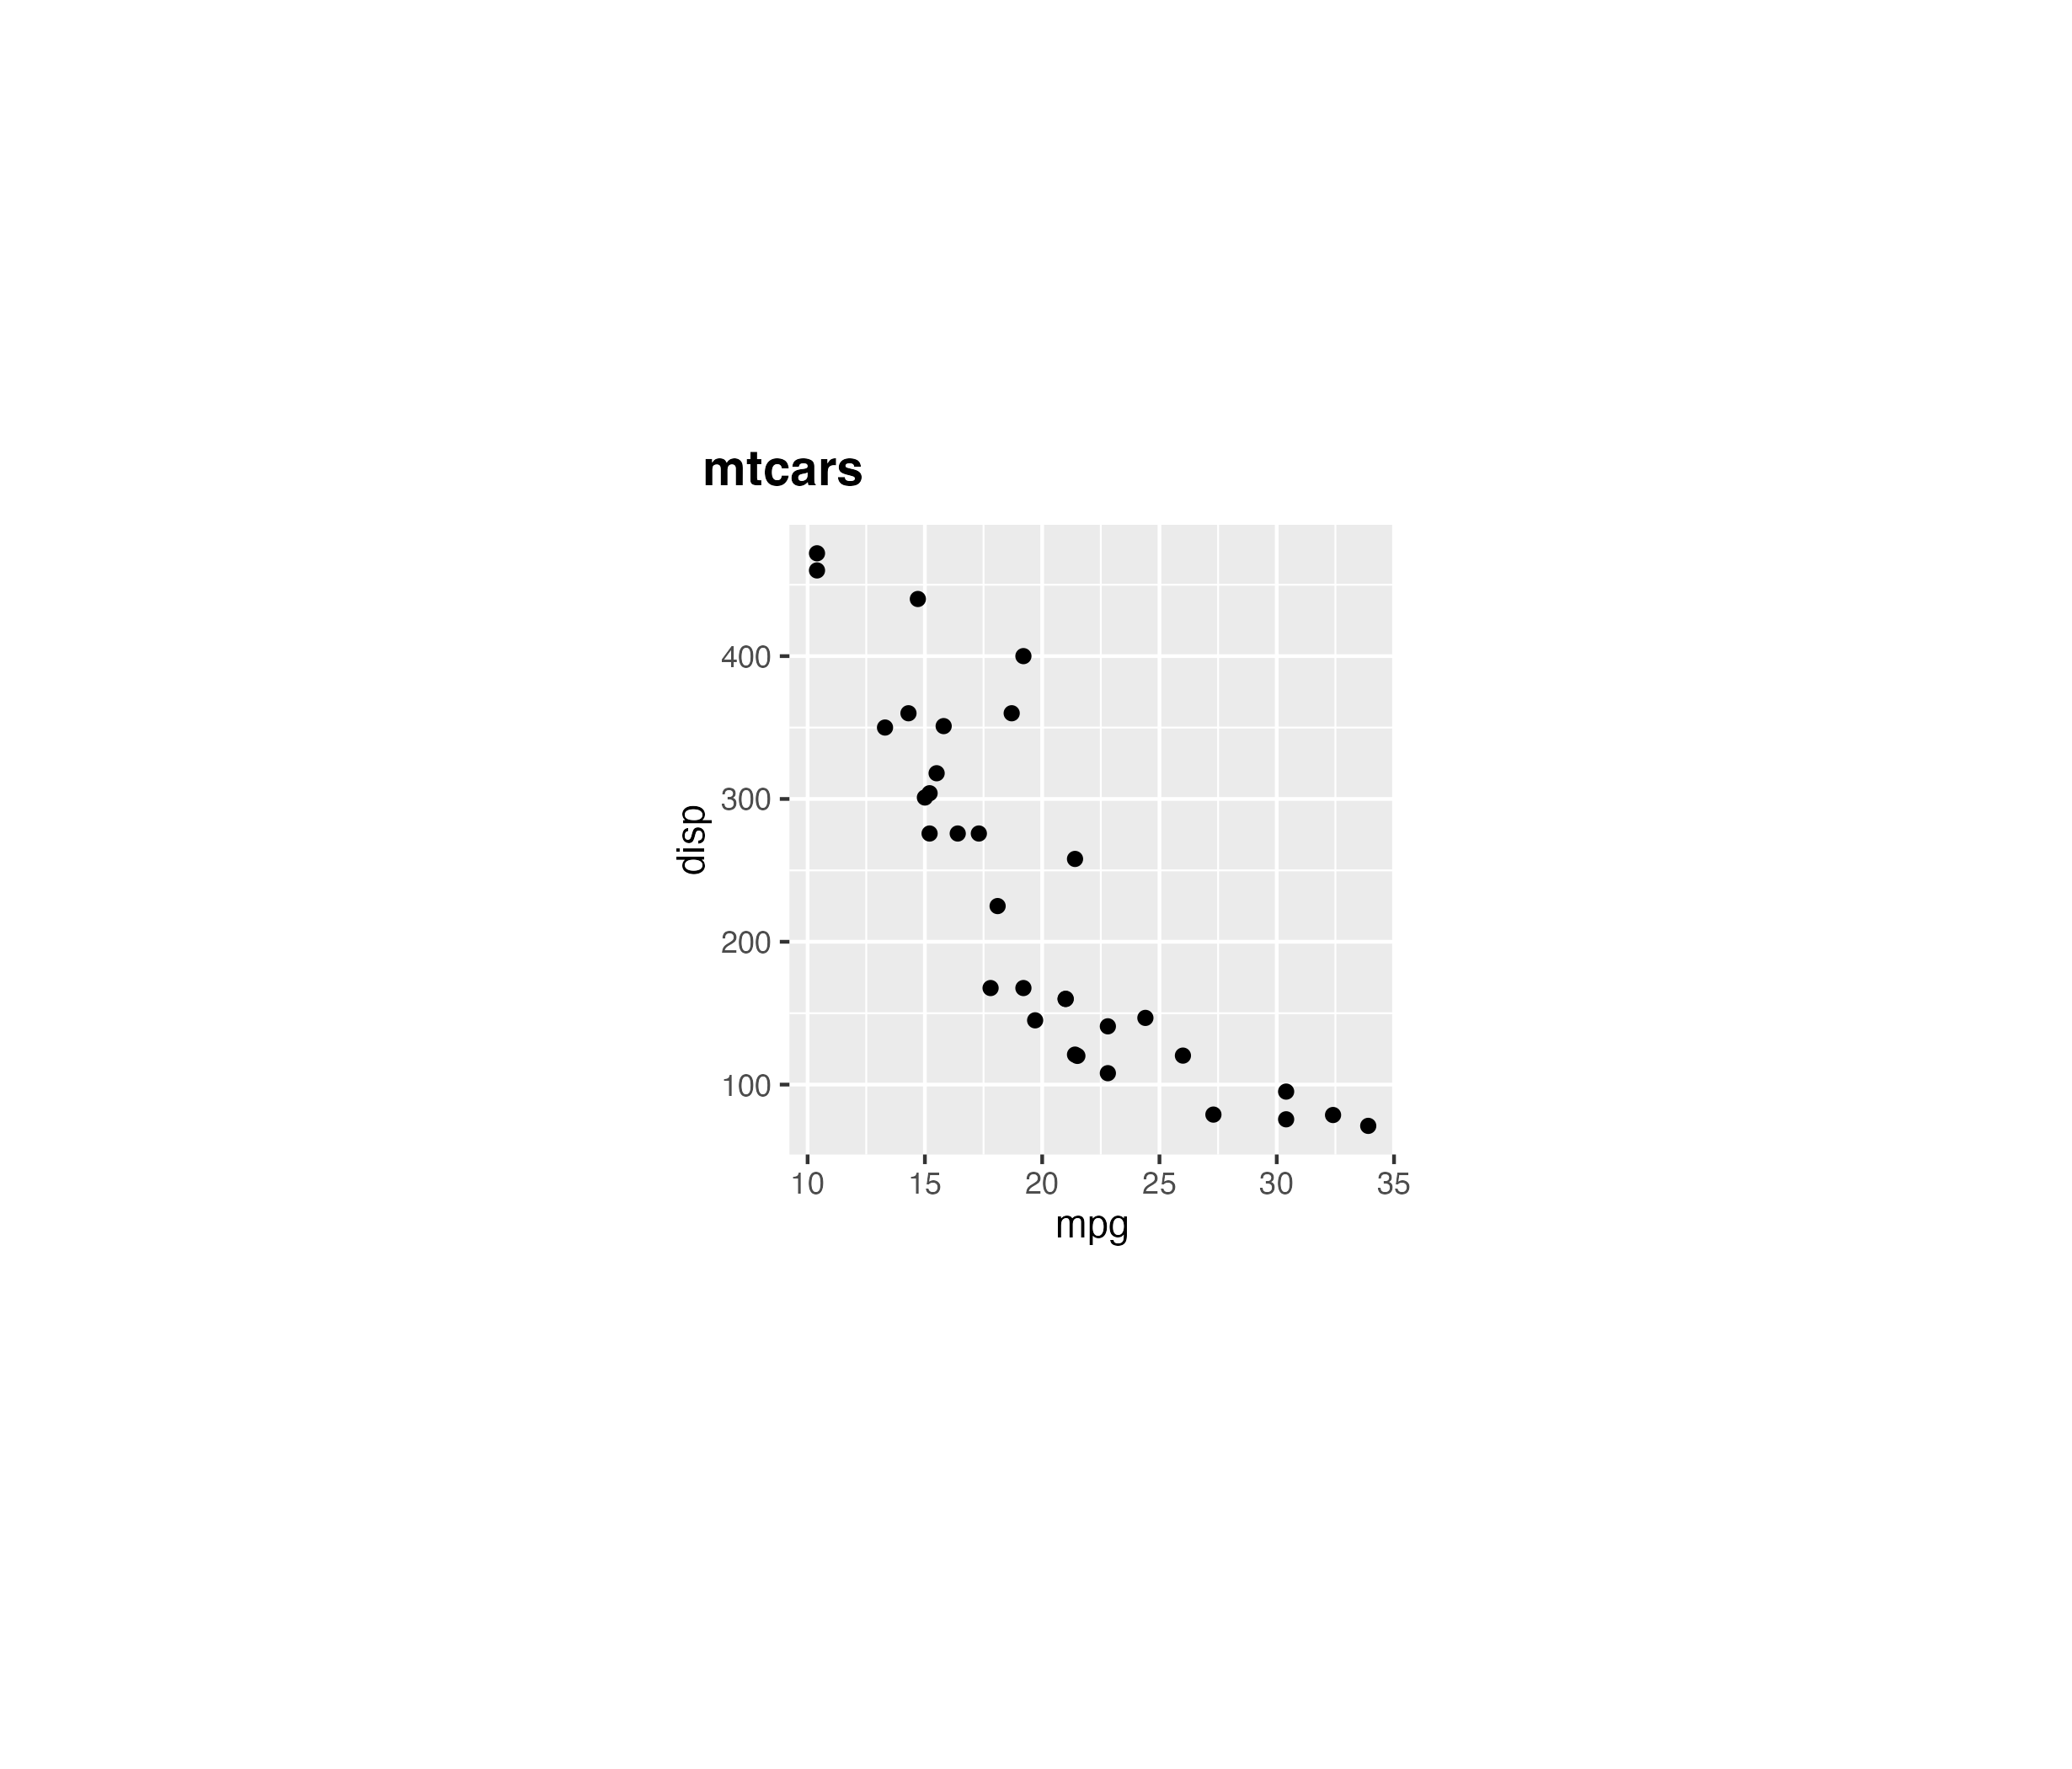
## Create a plot using ggplot2
library(ggplot2)
p <- ggplot(mtcars) +
    geom_point(aes(mpg, disp))

## Create a page
pageCreate(width = 4, height = 4, default.units = "inches")

## Place ggplot in page
plotGG(
    plot = p, x = 0.5, y = 0.5, width = 3, height = 3,
    just = c("left", "top"), default.units = "inches"
)
#> gg[gg1]

## Add title
plotText(
    label = "mtcars", fontsize = 14, fontface = "bold",
    x = 1, y = 0.35
)

#> text[text1]

## Hide page guides
pageGuideHide()
#> text[text1]
## Hide page guides
pageGuideHide()