Reshow guides drawn with pageCreate, pageGuideHorizontal, and pageGuideVertical
Source: R/pageGuideShow.R
pageGuideShow.RdReshow guides drawn with pageCreate,
pageGuideHorizontal, and pageGuideVertical
pageGuideShow()Value
None.
See also
Examples
## Load Hi-C data
library(plotgardenerData)
data("IMR90_HiC_10kb")
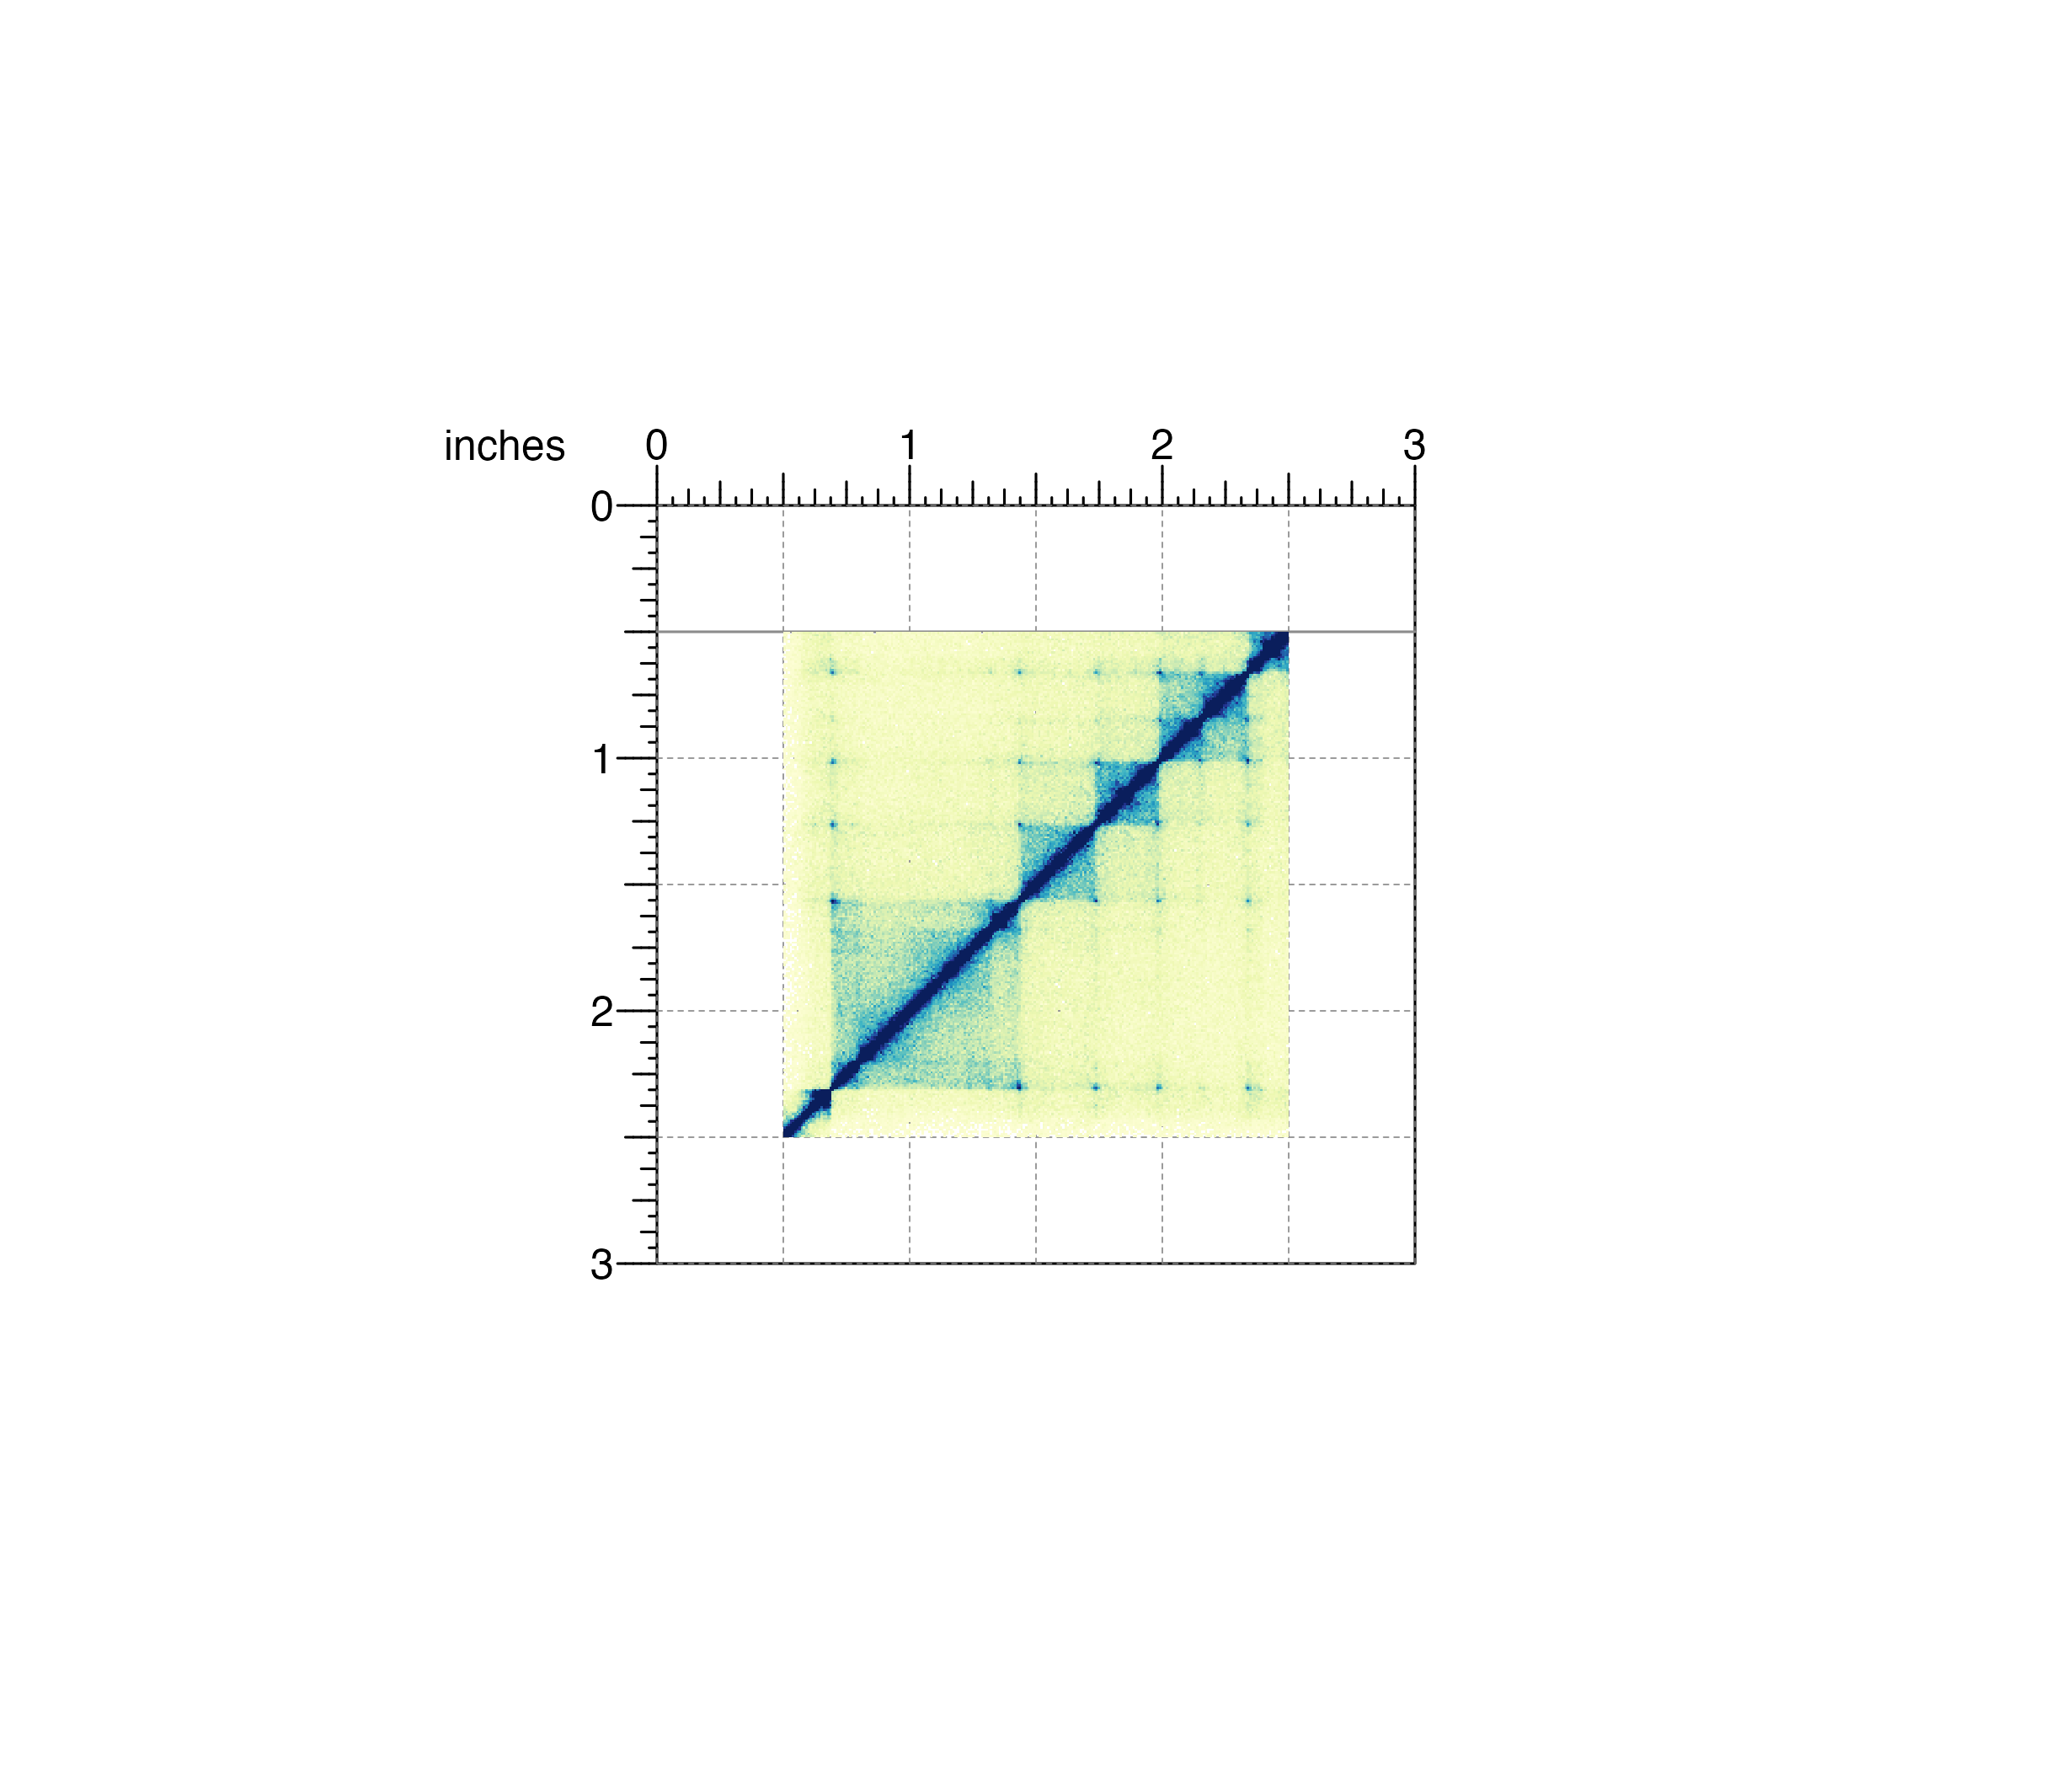
## Create a page
pageCreate(width = 3, height = 3, default.units = "inches")
## Add a page guide
pageGuideHorizontal(y = 0.5, default.units = "inches")
## Plot and place Hi-C plot
hicPlot <- plotHicSquare(
data = IMR90_HiC_10kb, resolution = 10000,
zrange = c(0, 70),
chrom = "chr21",
chromstart = 28000000, chromend = 30300000,
x = 0.5, y = 0.5, width = 2, height = 2,
just = c("left", "top"),
default.units = "inches"
)
#> Read in dataframe. Assuming 'chrom' in column1 and 'altchrom' in column2. 10000 BP resolution detected.
 #> hicSquare[hicSquare1]
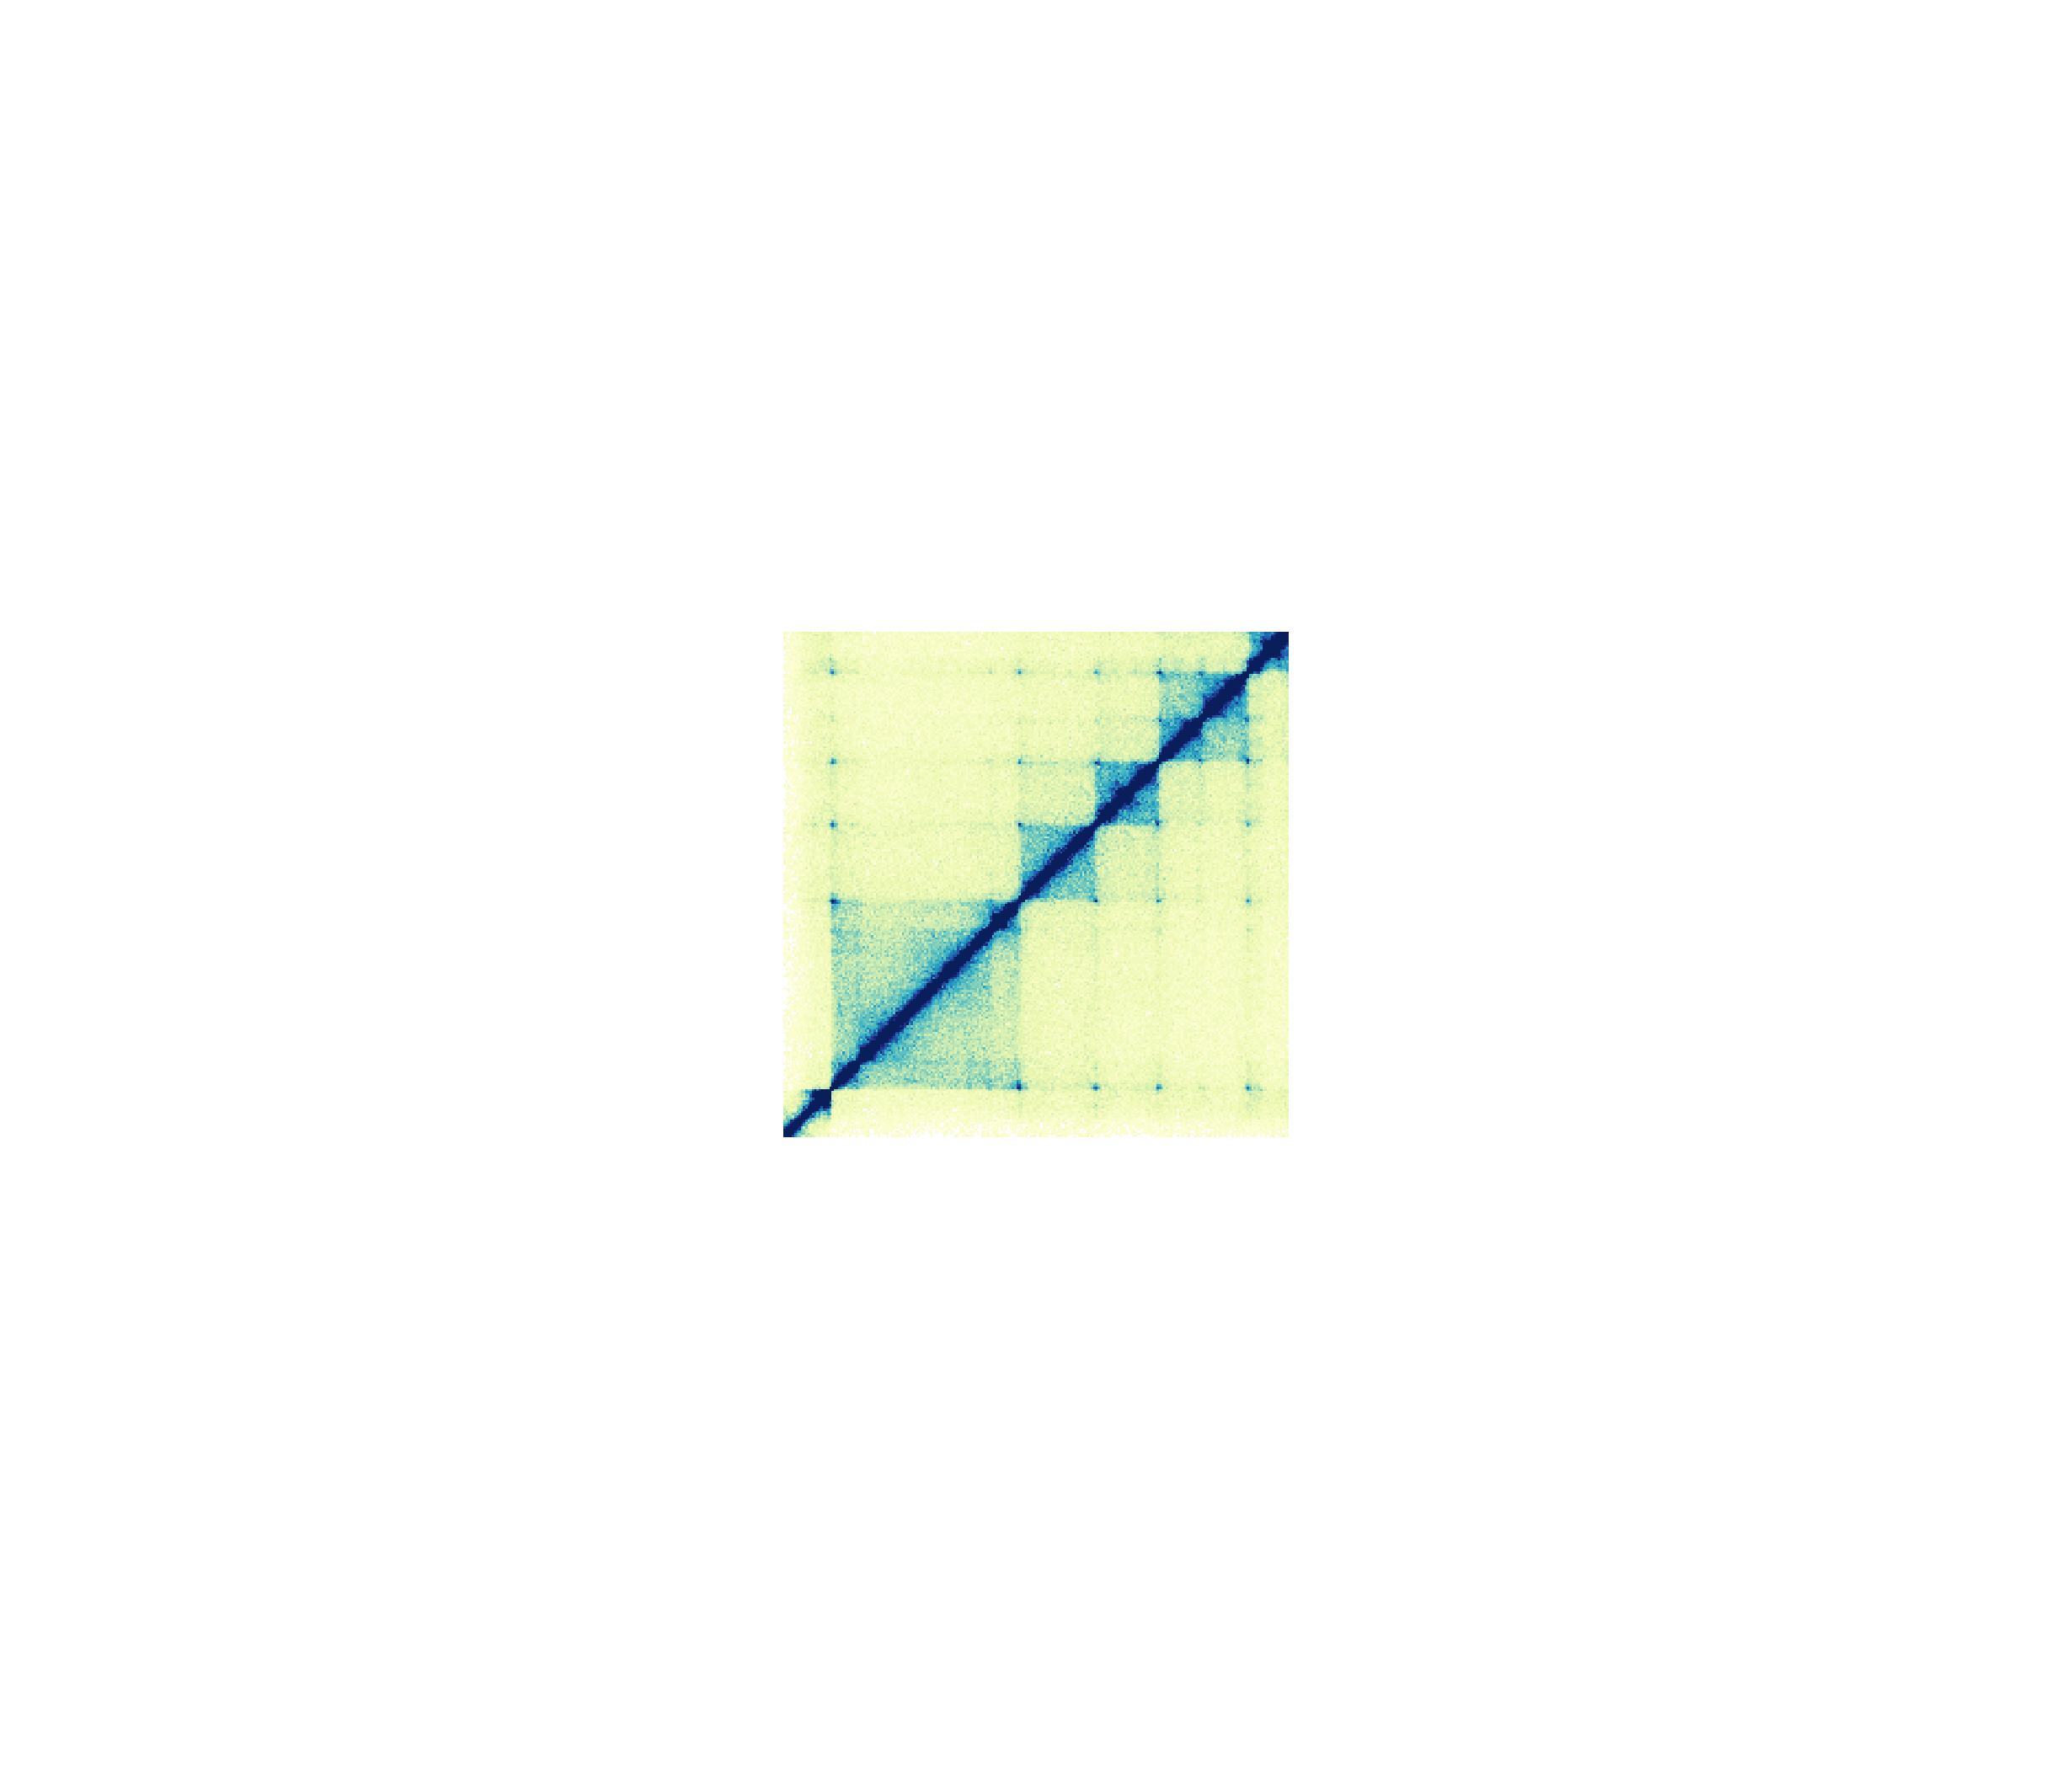
## Hide page guides
pageGuideHide()
#> hicSquare[hicSquare1]
## Hide page guides
pageGuideHide()
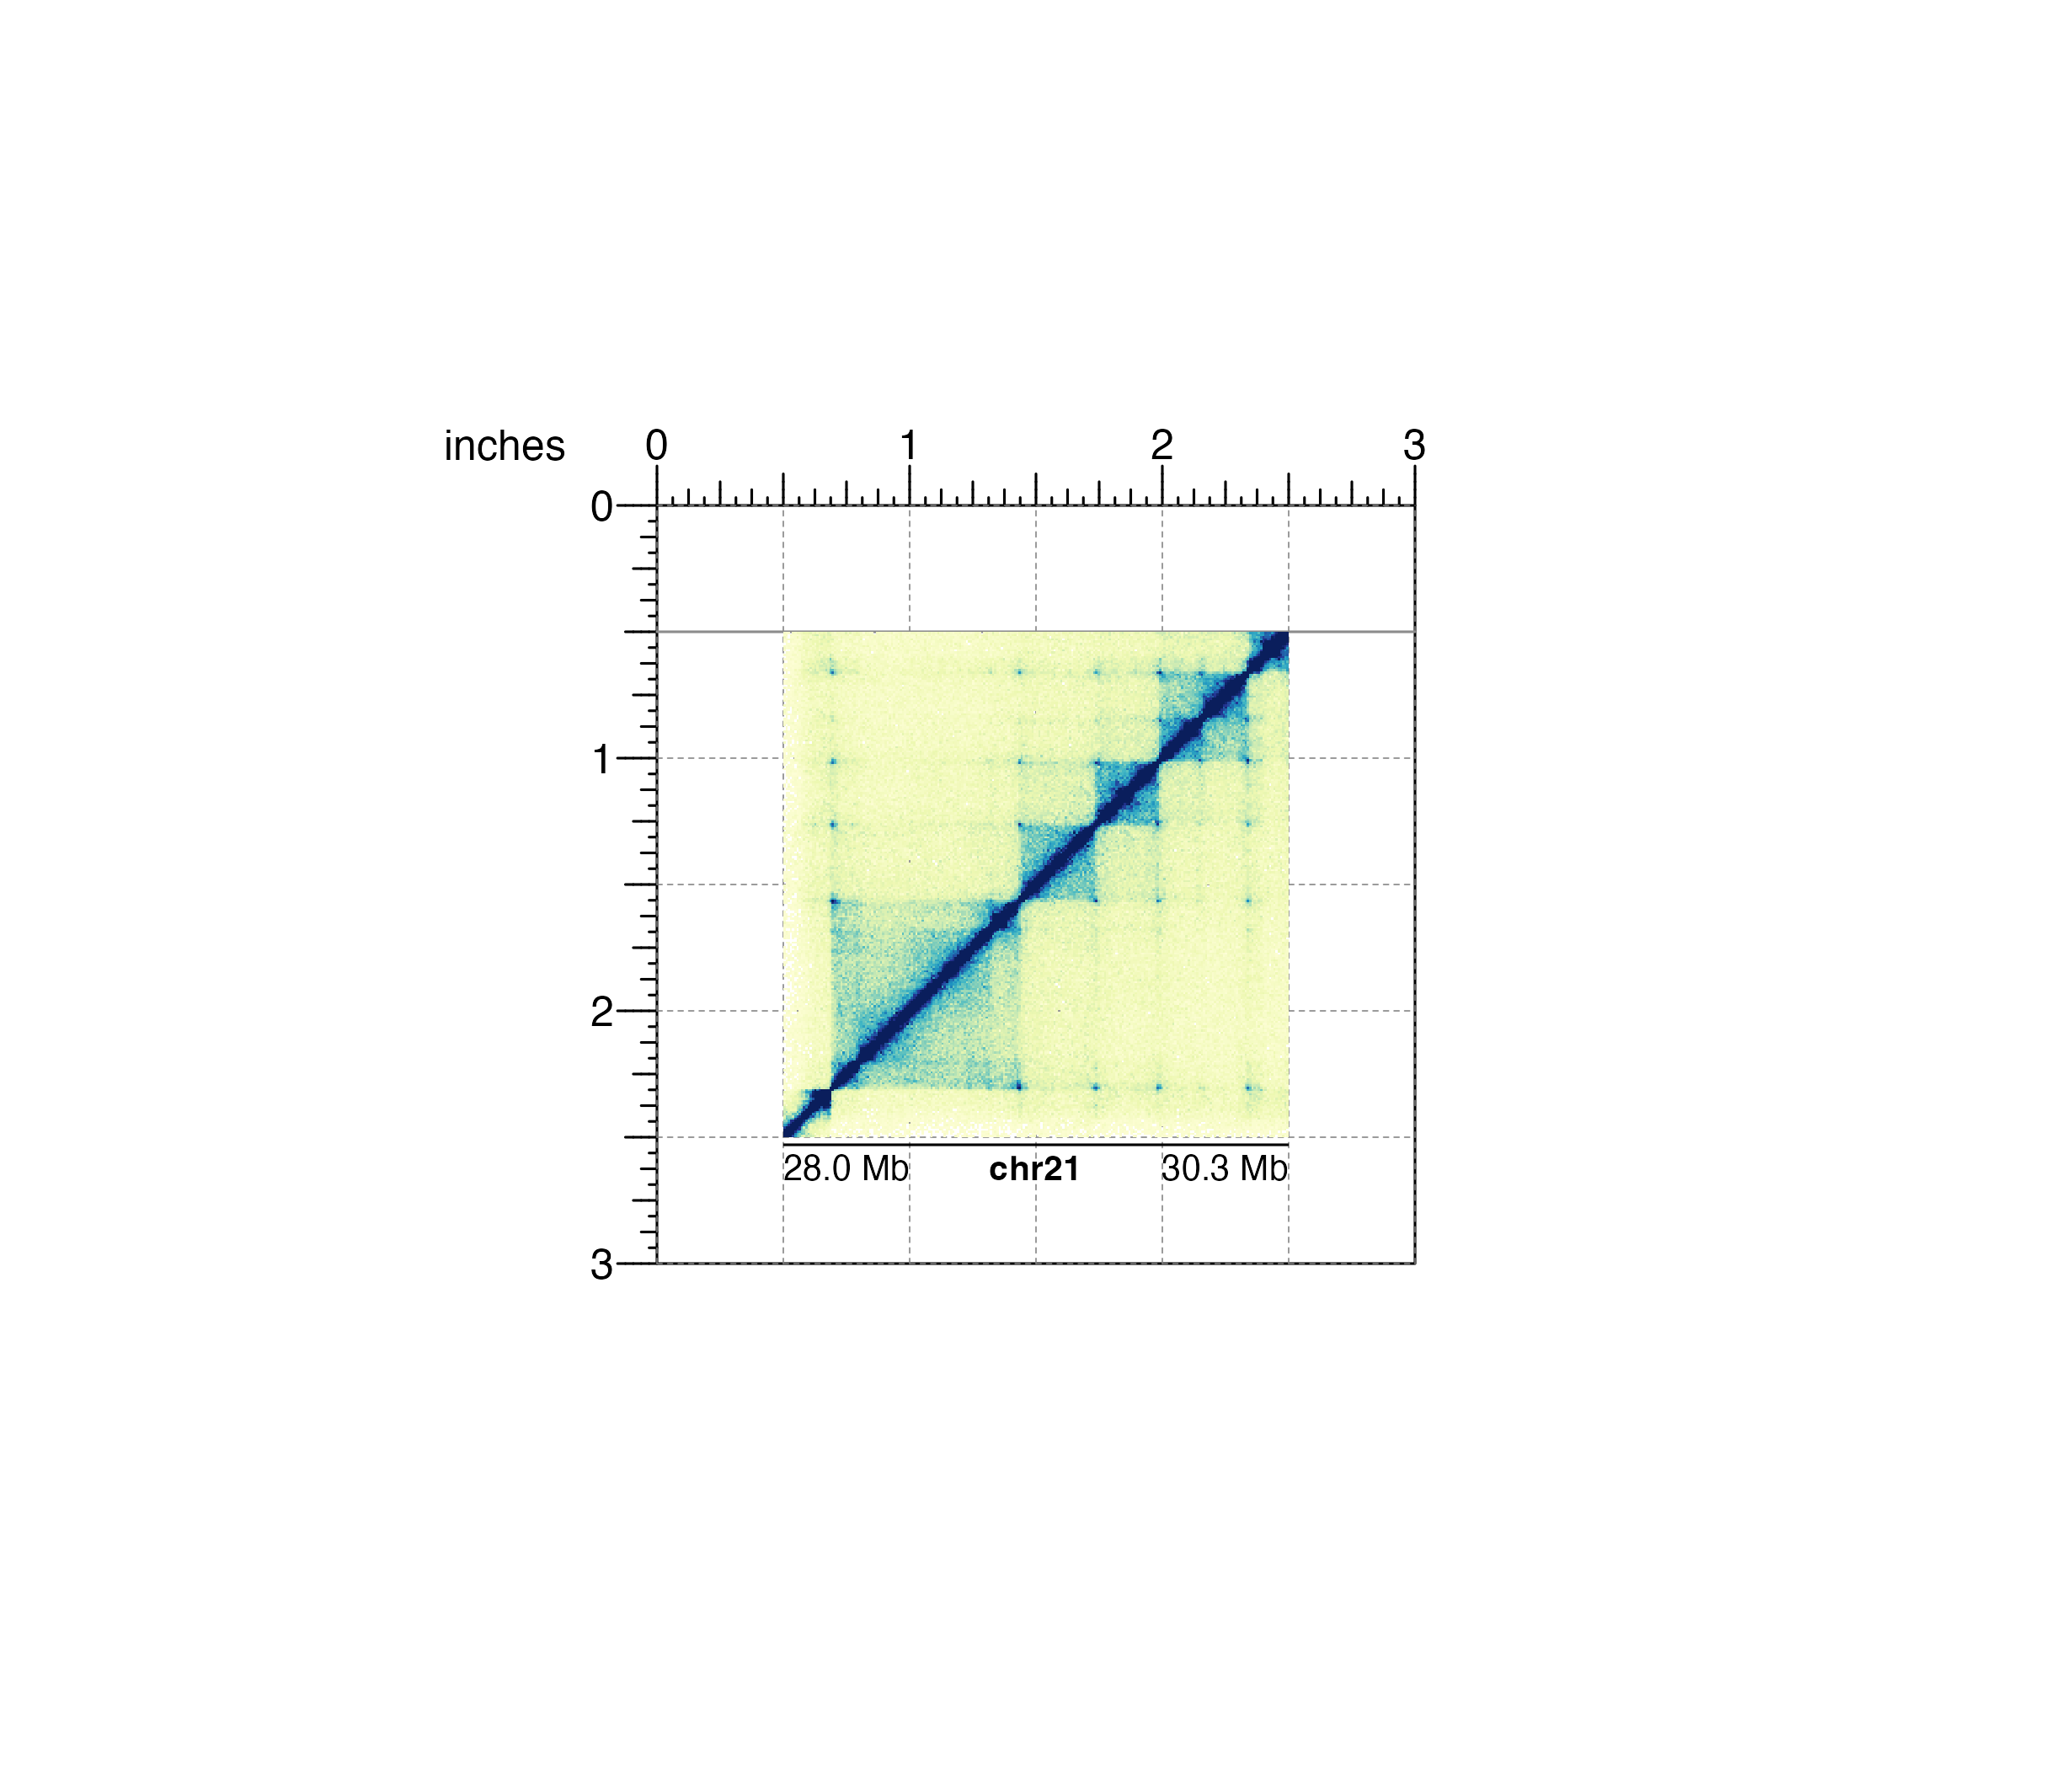
 ## Re-show page guides
pageGuideShow()
## Annotate genome label
annoGenomeLabel(
plot = hicPlot, scale = "Mb", axis = "x",
x = 0.5, y = 2.53, just = c("left", "top")
)
## Re-show page guides
pageGuideShow()
## Annotate genome label
annoGenomeLabel(
plot = hicPlot, scale = "Mb", axis = "x",
x = 0.5, y = 2.53, just = c("left", "top")
)
 #> genomeLabel[genomeLabel1]