Annotates text within a plot
annoText(
    label,
    fontcolor = "black",
    fontsize = 12,
    rot = 0,
    check.overlap = FALSE,
    plot,
    x,
    y,
    just = "center",
    default.units = "native",
    params = NULL,
    ...
)
Arguments
- label
Character or expression of text to be plotted.
- fontcolor
A character value specifying text fontcolor. Default value is
fontcolor = "black".- fontsize
A numeric specifying text fontsize in points. Default value is
fontsize = 12.- rot
A numeric specifying the angle to rotate the text. Default value is
rot = 0.- check.overlap
A logical value to indicate whether to check for and omit overlapping text. Default value is
check.overlap = FALSE.- plot
Input plotgardener plot to internally place text relative to.
- x
A numeric vector or unit object specifying text x-location.
- y
A numeric vector or unit object specifying text y-location.
- just
Justification of text relative to its (x, y) location. If there are two values, the first value specifies horizontal justification and the second value specifies vertical justification. Possible string values are:
"left","right","centre","center","bottom", and"top". Default value isjust = "center".- default.units
A string indicating the default units to use if
xoryare only given as numerics or numeric vectors. Default value isdefault.units = "native".- params
An optional pgParams object containing relevant function parameters.
- ...
Additional grid graphical parameters. See gpar.
Value
Returns a text object containing
relevant placement and grob information.
See also
Examples
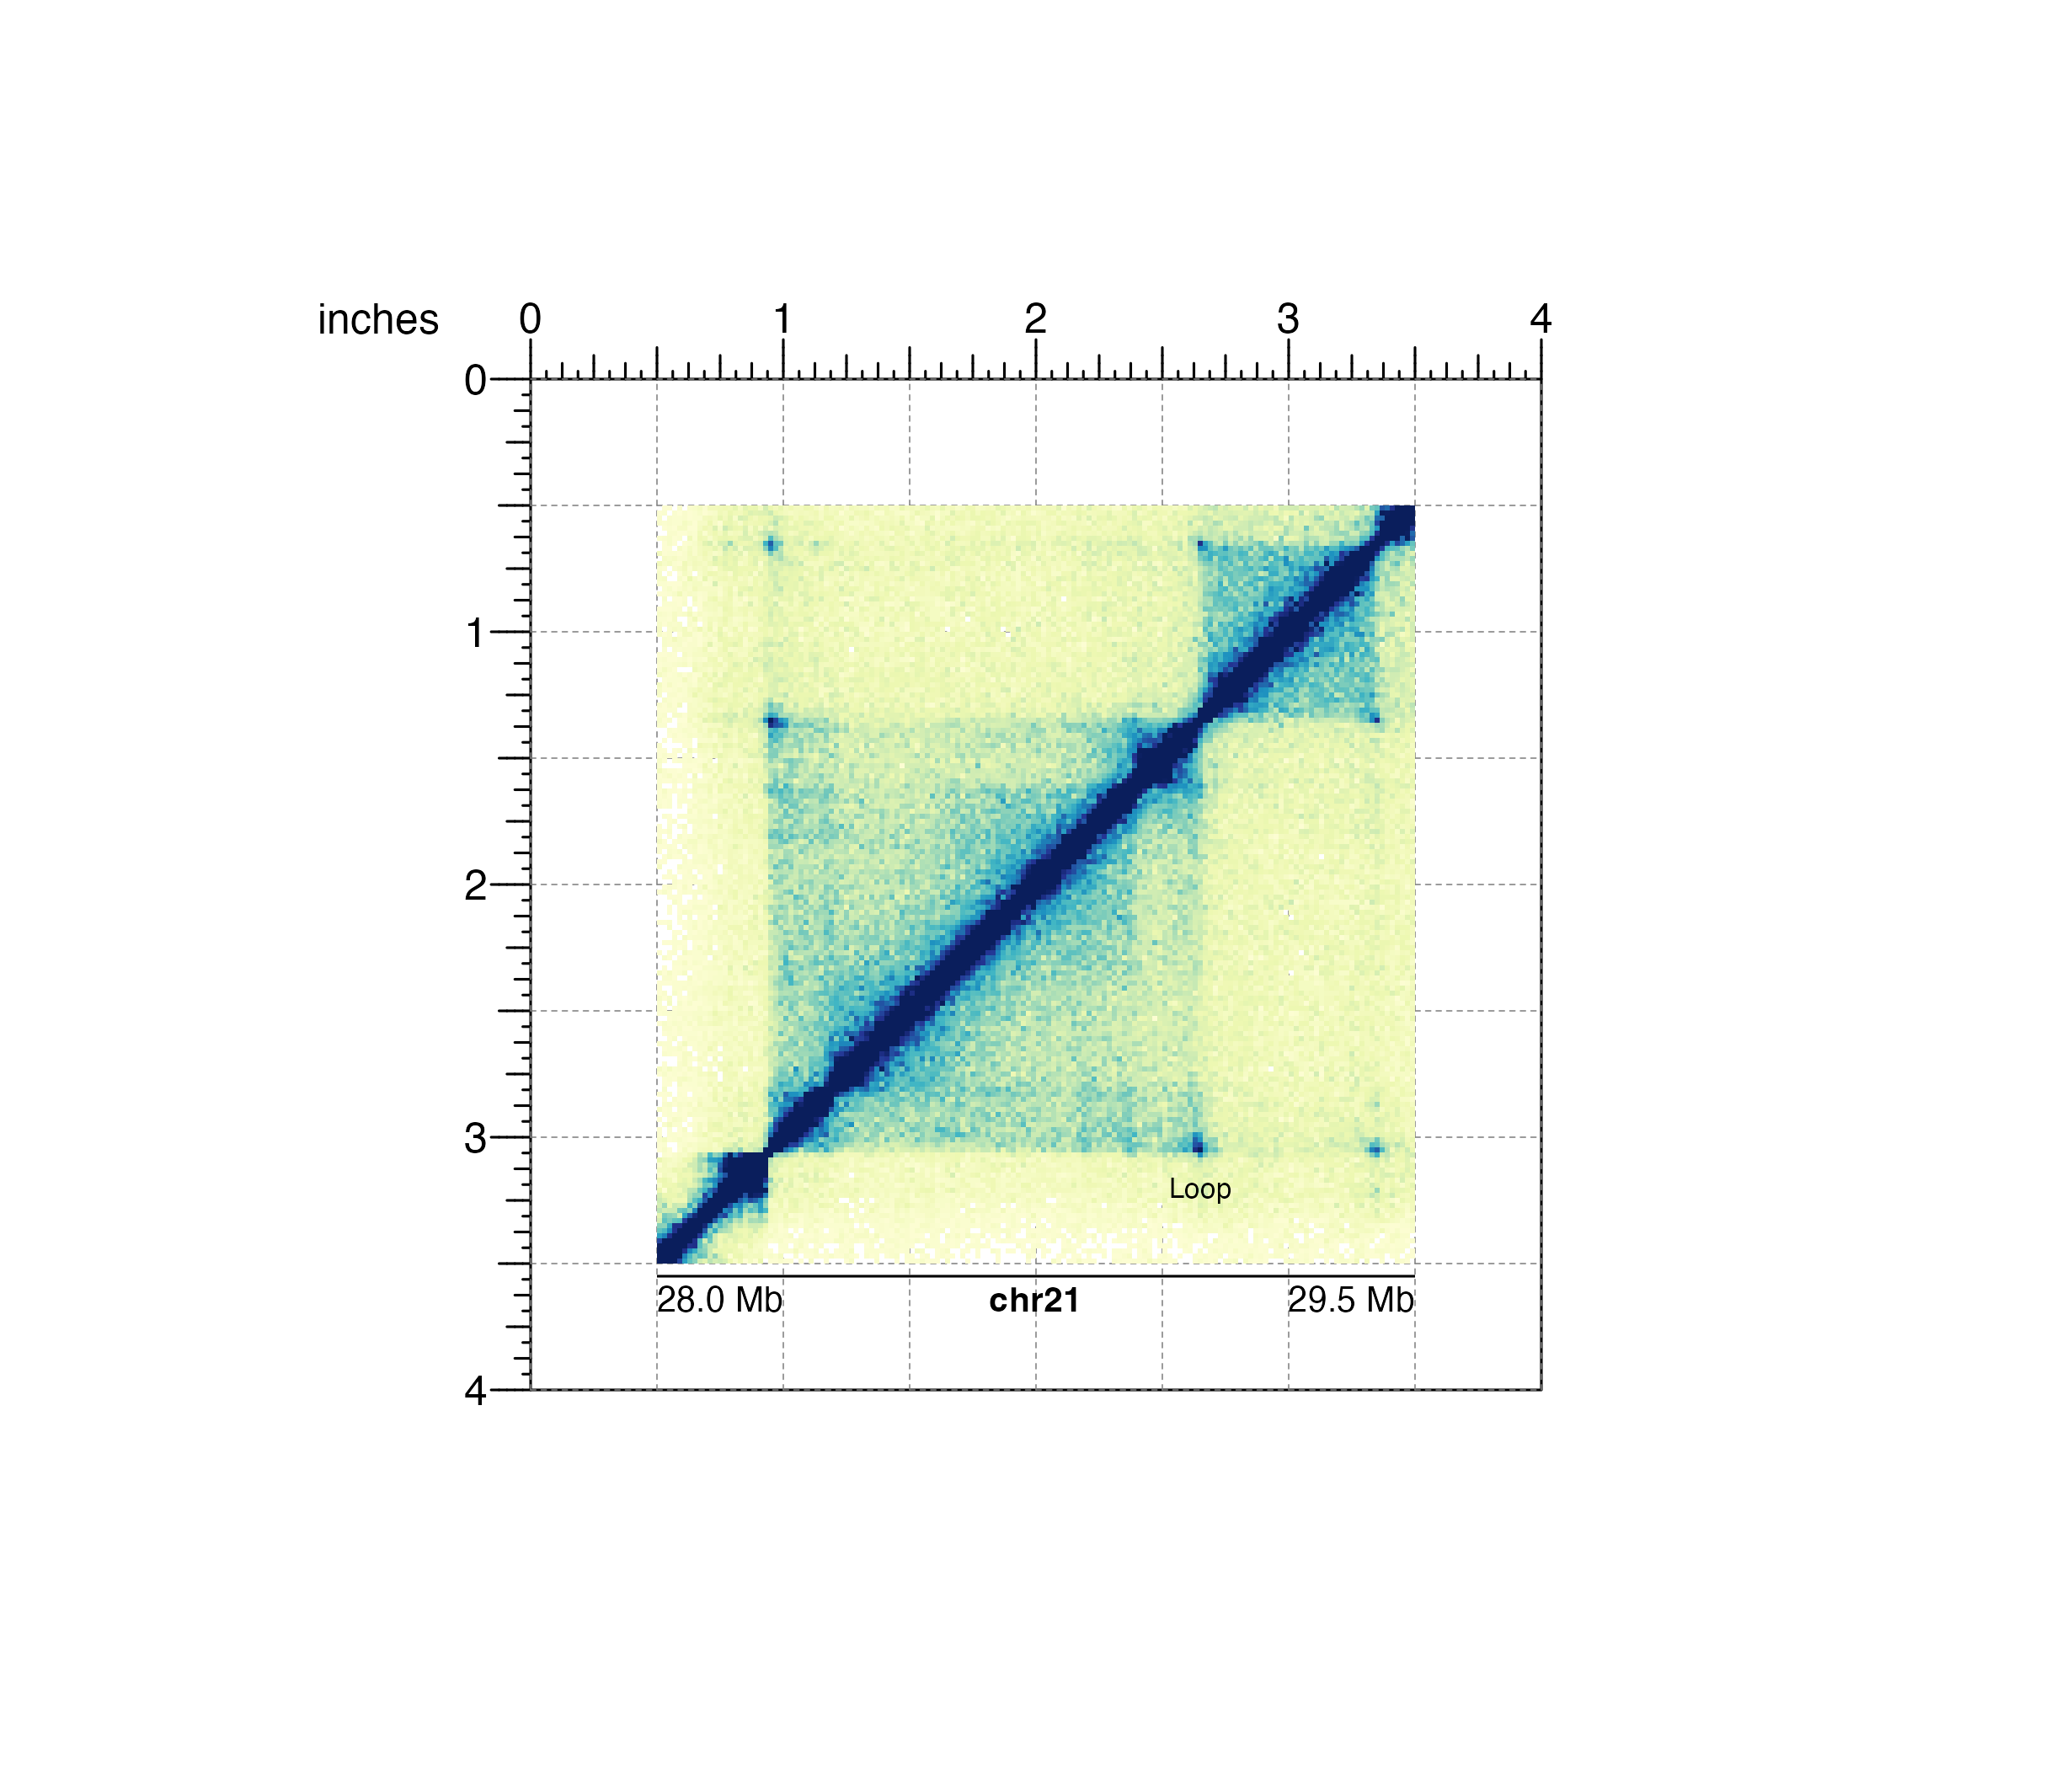
## Create a page
pageCreate(width = 4, height = 4, default.units = "inches")
## Plot text relative to a plotgardener plot
library(plotgardenerData)
data("IMR90_HiC_10kb")
hicPlot <- plotHicSquare(
data = IMR90_HiC_10kb, chrom = "chr21",
chromstart = 28000000, chromend = 29500000,
assembly = "hg19",
zrange = c(0, 70),
x = 0.5, y = 0.5, width = 3, height = 3,
just = c("left", "top"),
default.units = "inches"
)
#> Read in dataframe. Assuming 'chrom' in column1 and 'altchrom' in column2. 10000 BP resolution detected.
#> hicSquare[hicSquare1]
annoGenomeLabel(
plot = hicPlot, x = 0.5, y = 3.55, scale = "Mb",
just = c("left", "top"), default.units = "inches"
)
#> genomeLabel[genomeLabel1]
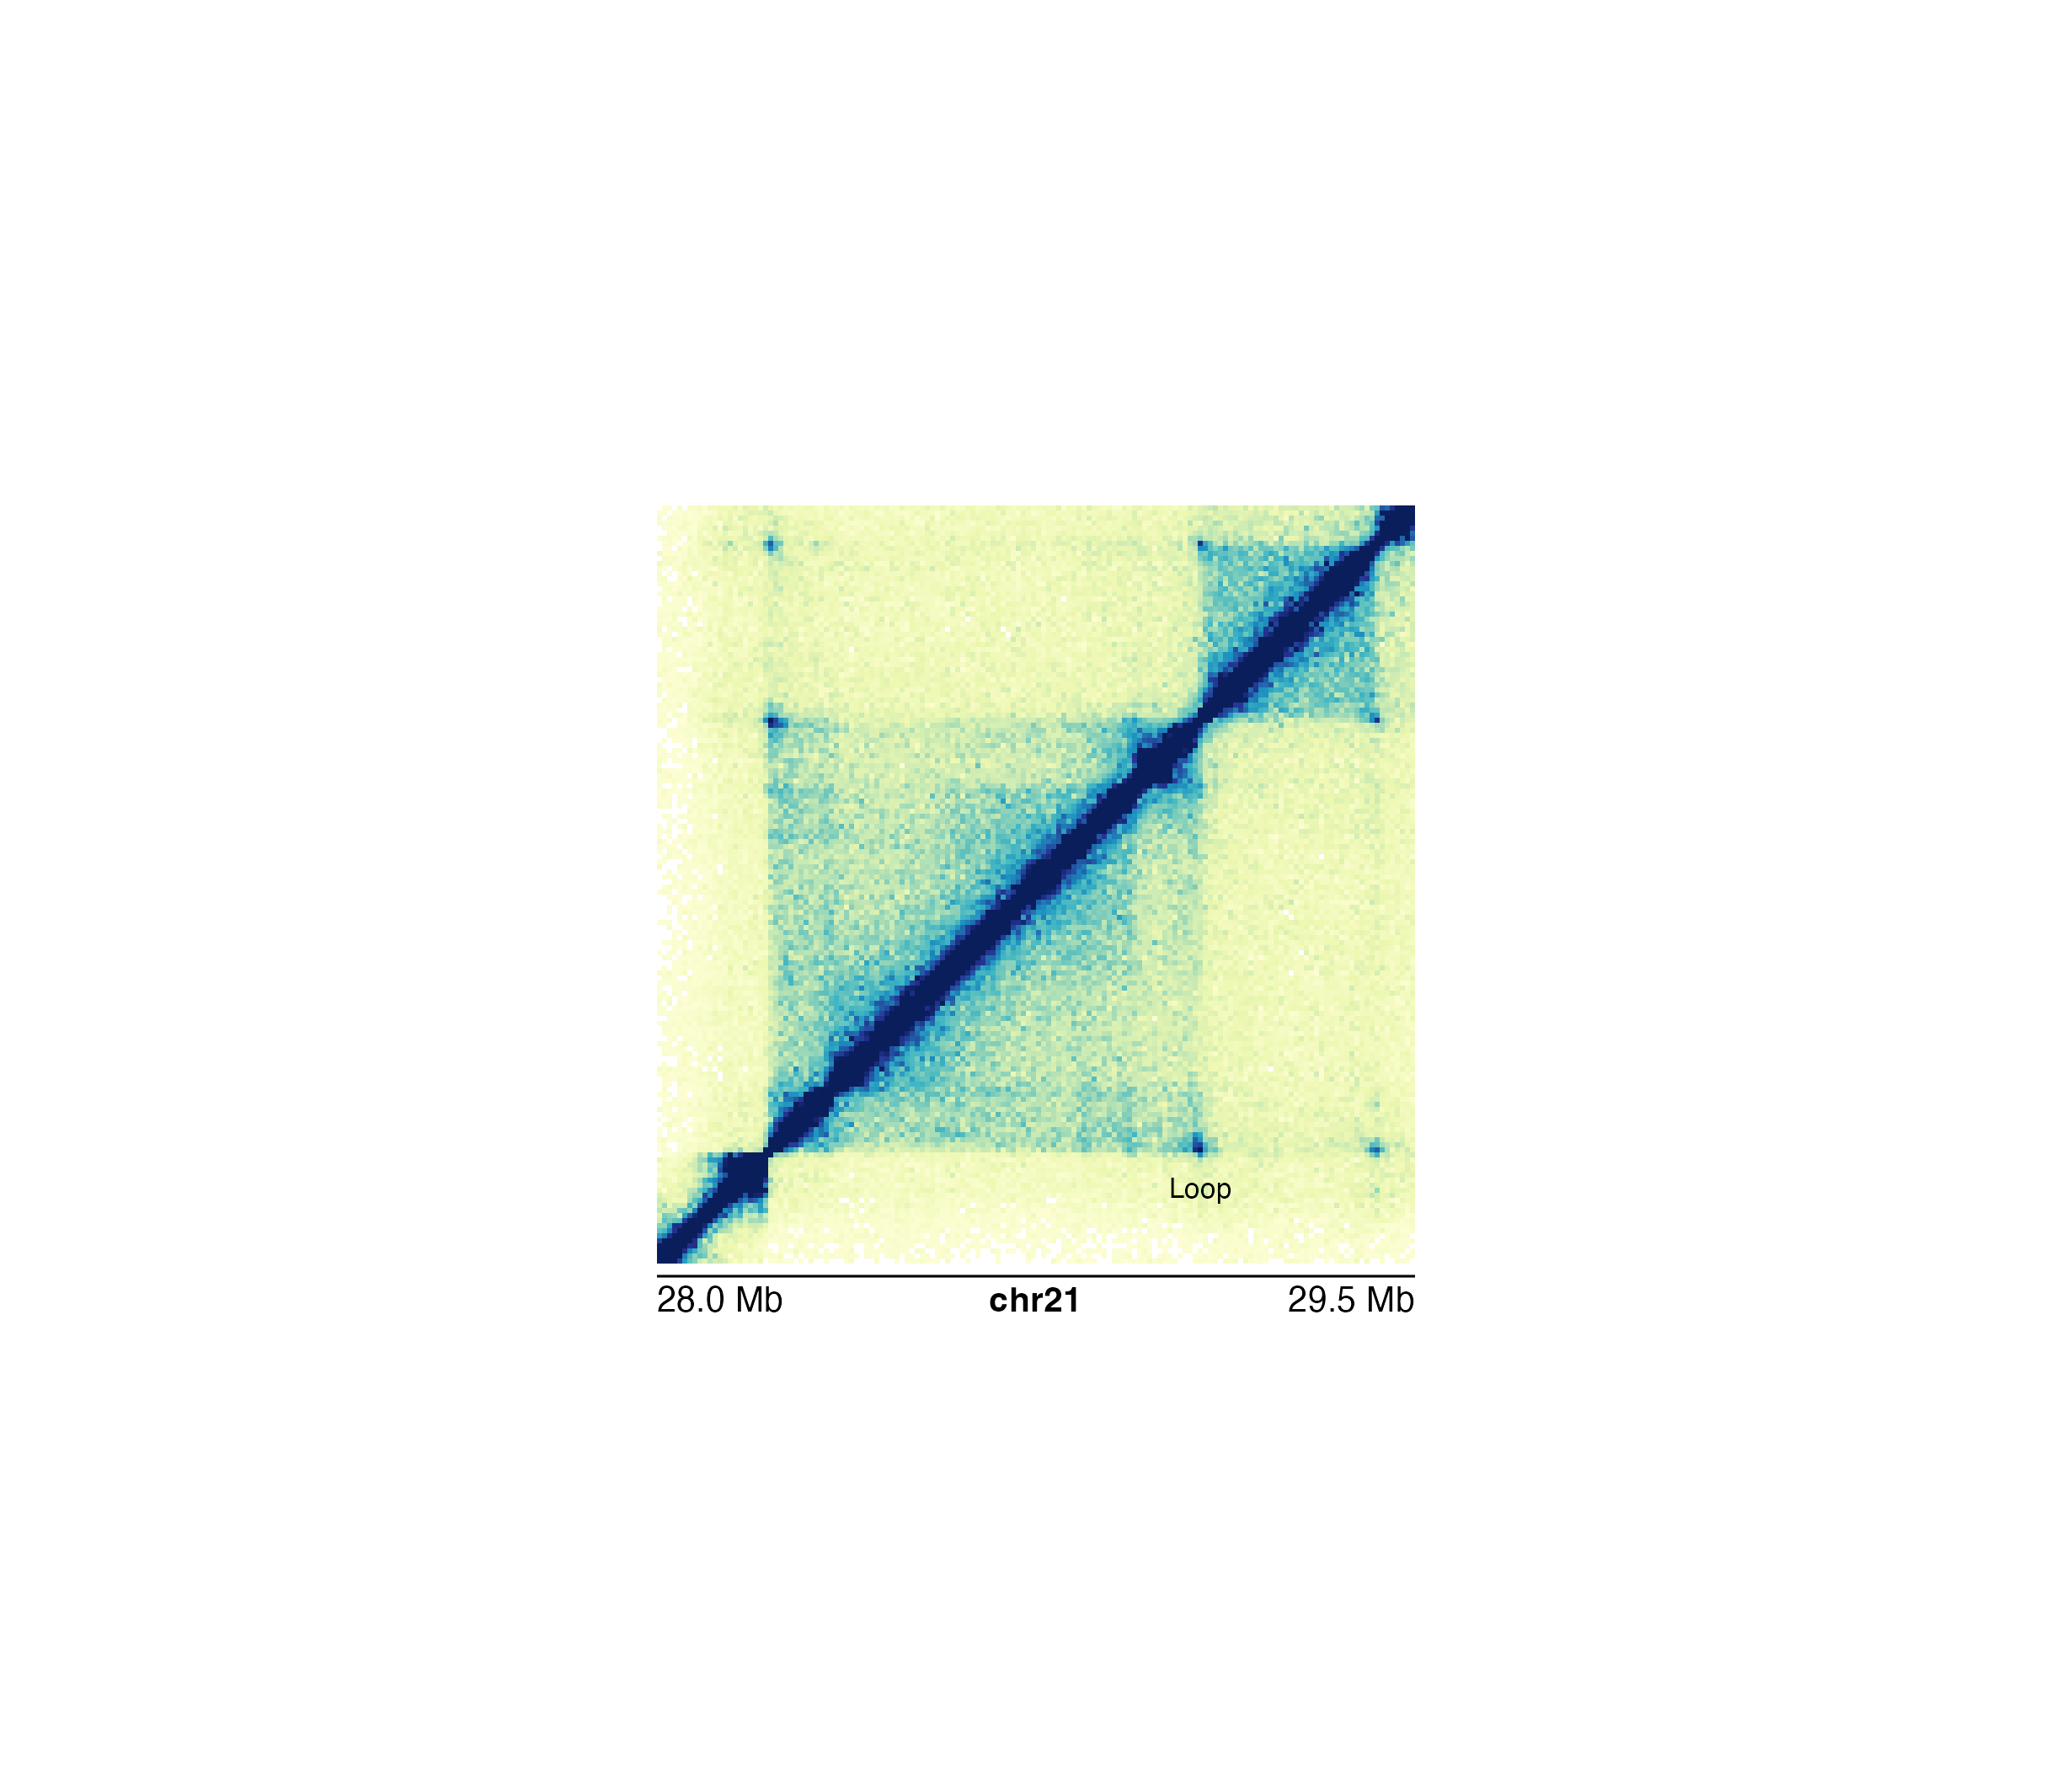
annoText(
label = "Loop", fontsize = 8, plot = hicPlot,
x = 29075000, y = 28150000,
just = "center", default.units = "native"
)
 #> text[text1]
## Hide page guides
pageGuideHide()
#> text[text1]
## Hide page guides
pageGuideHide()