We’re excited to announce our new graphic user interface (GUI) for
plotgardener! plotgardenerUI is our new
cross-platform desktop app that brings the full functionality of
plotgardener to a point-and-click interface, so researchers
can build publication-quality genomic figures with zero programming
experience. Powered by Electron, React, and a
live parser that stays in sync with the R package automatically.
What is plotgardenerUI?
plotgardener is an R/Bioconductor package for building
flexible, multi-panel, publication-quality genomic visualizations. It
has been downloaded over a thousand times and cited in over 100 papers,
but using it requires proficiency in R, package management, and the
command line. For many biologists, that can be a significant
barrier.
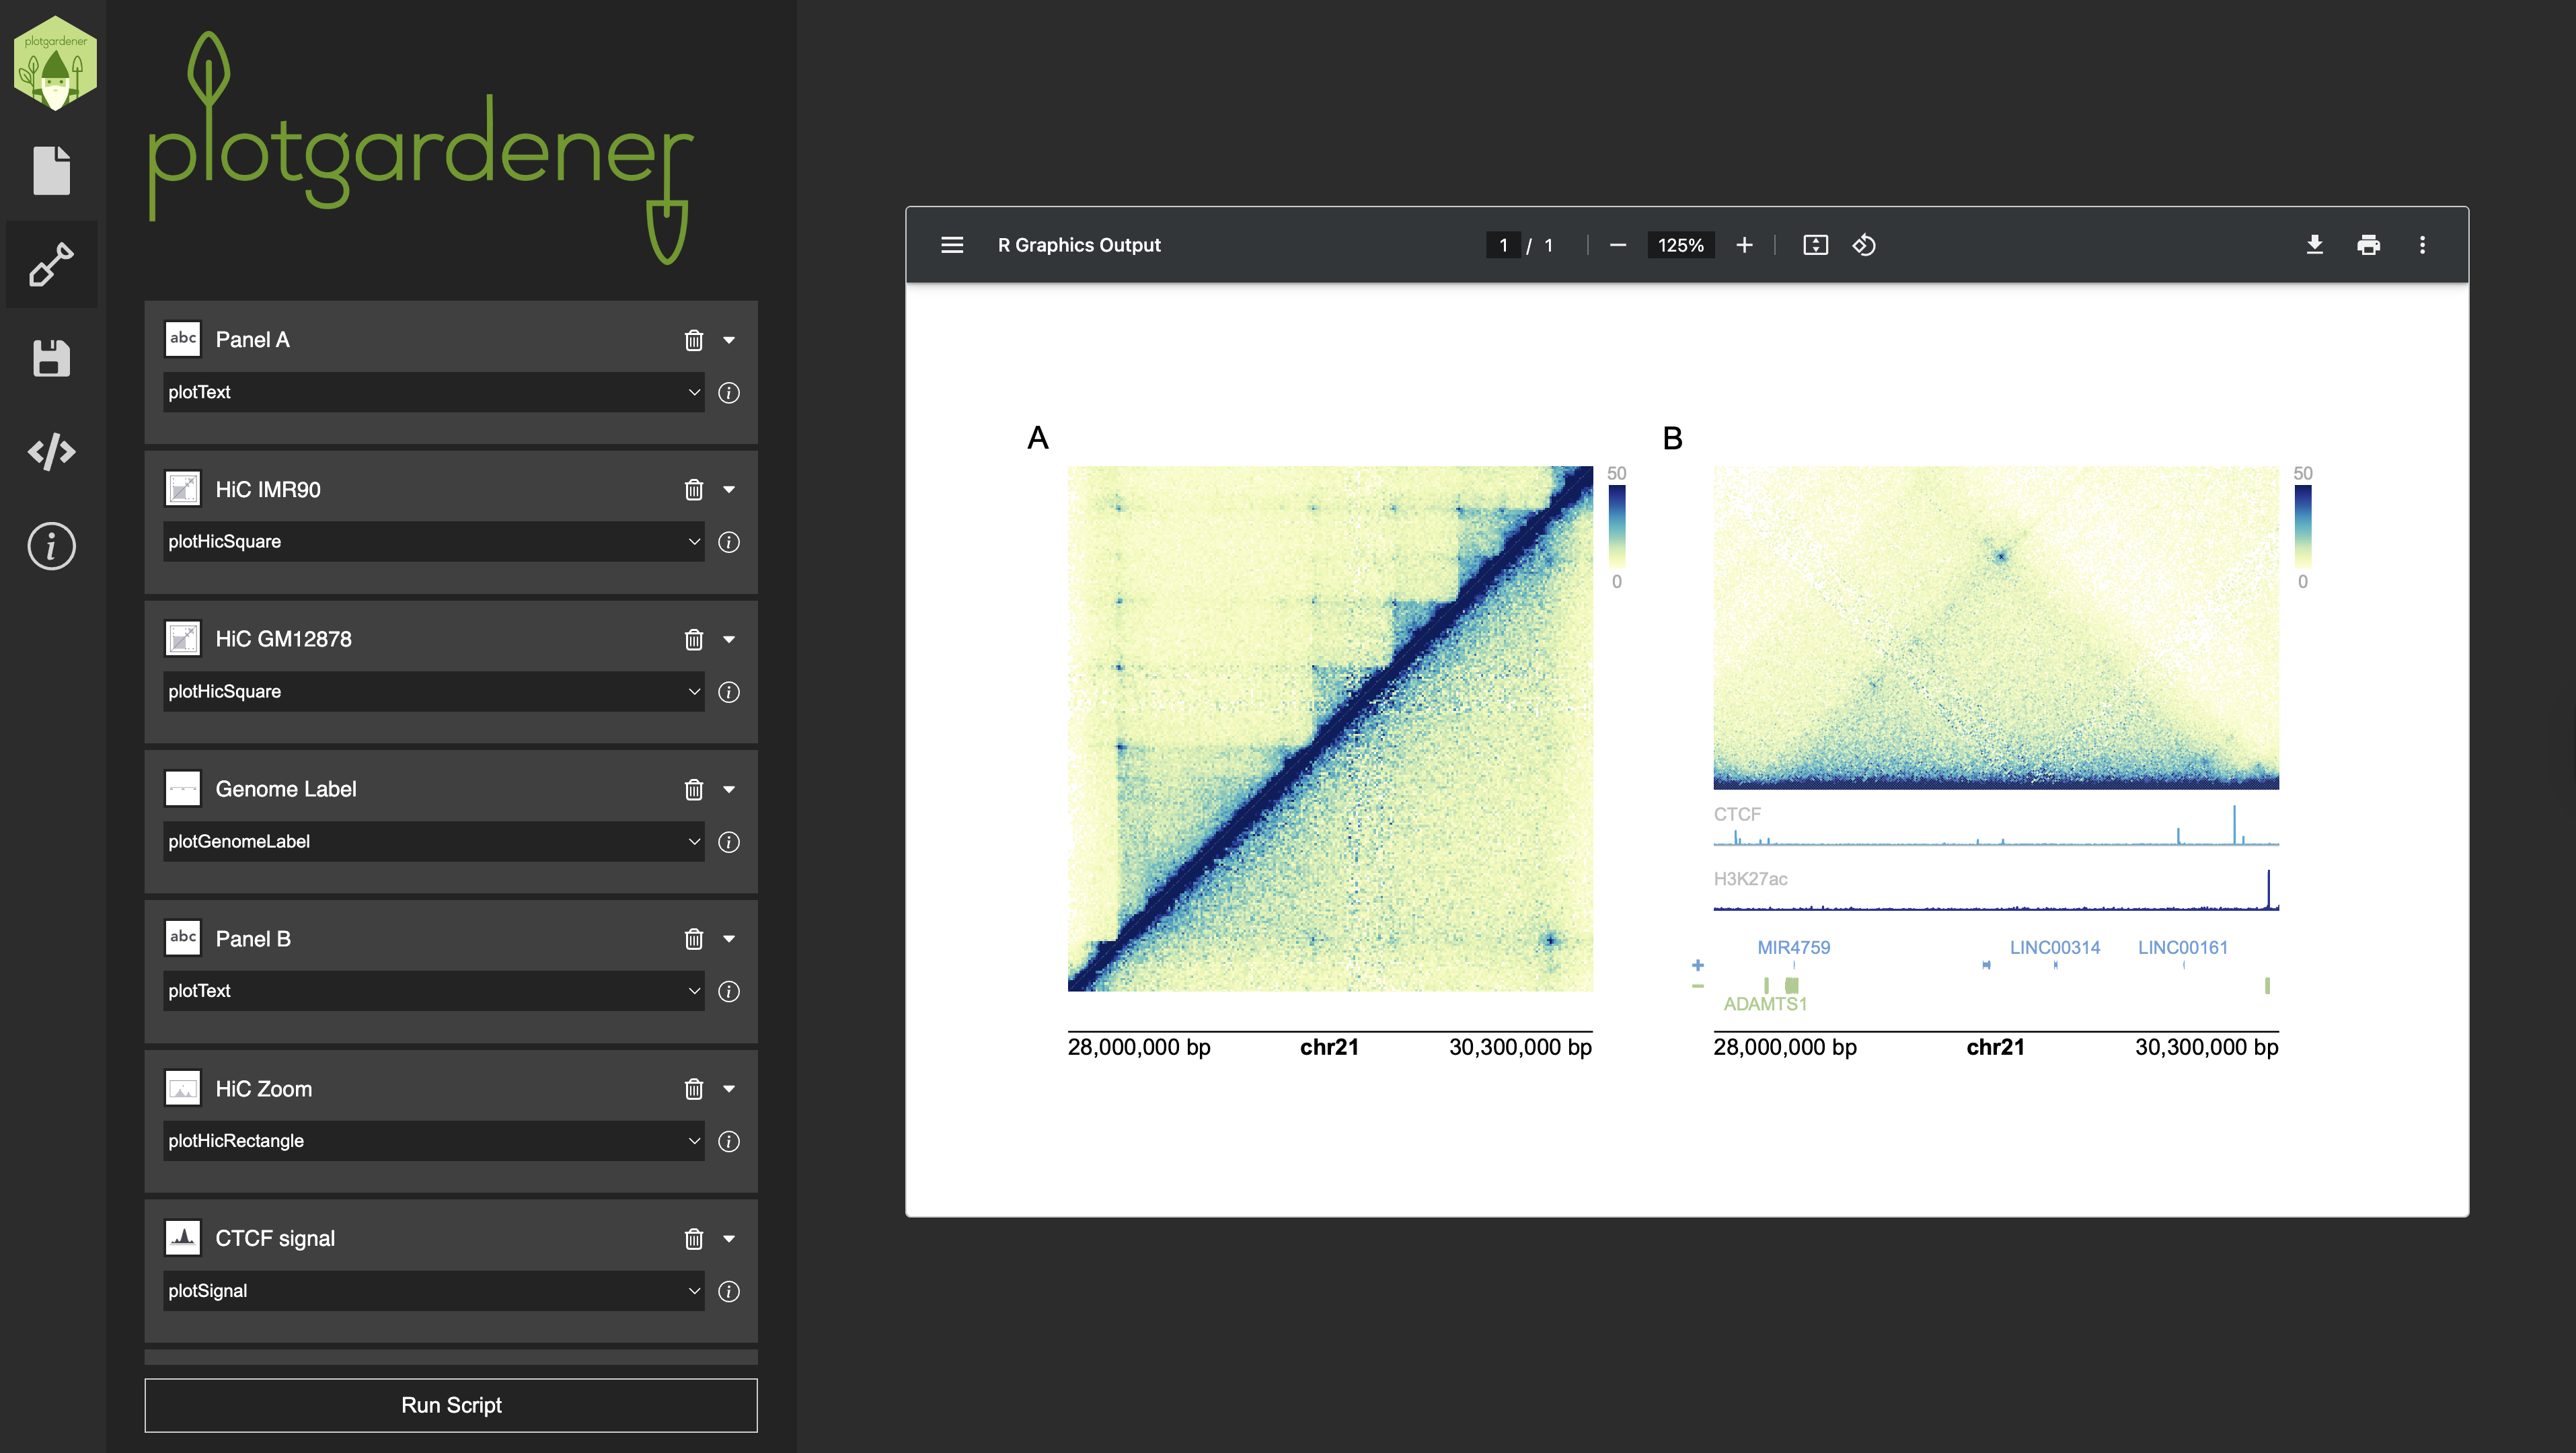
plotgardenerUI is a cross-platform desktop application
that wraps the plotgardener R package in a graphical
interface, making its full feature set available in a no-code
environment. Users can add and configure Hi-C contact maps, signal
tracks, gene models, genome labels, and more, all through
point-and-click menus. Users can preview a live rendering of their
figure as they work, and when the figure is ready, the app displays the
underlying R script so that advanced users can copy and extend it
further in any IDE.
Installation
plotgardenerUI is distributed as a single
.dmg file that bundles all prerequisites in one desktop
application, no R installation or terminal setup required. To get
started:
- Download the latest
.dmgfrom GitHub (Windows, Mac) - Double-click the
.dmgto install - Open the app and start building
The source code is open and available at: github.com/rishabhsvemuri/pgUI
How it works
The interface is organized into four tabs:
Page: Set page dimensions and units before adding any plots.
Plots: Add, name, and configure as many plot panels as needed, chosen from a dropdown of all supported plotgardener functions. Each panel includes data upload via browse buttons, text parameter fields, and automatic validation of required inputs. Annotations can be layered on top of any plot panel.
Save: Save and reload your entire session as a structured JSON file, enabling figure templates and easy sharing between collaborators across machines.
Code: View the R script the app generates in real time. Copy it directly into an IDE for further customization.
Clicking Run Script compiles all panel inputs, executes
the R script in a background session, and displays the rendered figure
in the always-open preview pane.
Under the hood
plotgardenerUI is built on Electron and
comprises three layers:
Frontend (
React): Renders all user-facing tabs and form elements, dynamically populated based on the selected plotgardener function.Backend (
Node.js): Manages all parameter inputs, maintains panel state across additions and edits, compiles the final R script, and returns the PDF output to the preview pane.Parser (
Python): Parses the live plotgardener R package source (functions, parameters, and documentation) into structured JSON. This means the interface stays automatically synchronized with any updates to the package, with no manual maintenance required.
Source code & documentation
-
plotgardenerUIsource: github.com/rishabhsvemuri/pgUI -
plotgardenerR package docs: phanstiellab.github.io/plotgardener