Plot a rectangle within a plotgardener layout
plotRect(
    x,
    y,
    width,
    height,
    just = "center",
    default.units = "inches",
    linecolor = "black",
    lwd = 1,
    lty = 1,
    fill = NA,
    alpha = 1,
    params = NULL,
    ...
)
Arguments
- x
A numeric vector or unit object specifying rectangle x-locations.
- y
A numeric vector, unit object, or a character vector of values containing a "b" combined with a numeric value specifying rectangle y-locations. The character vector will place rectangle y-locations relative to the bottom of the most recently plotted plot according to the units of the plotgardener page.
- width
A numeric vector or unit object specifying rectangle widths.
- height
A numeric vector or unit object specifying rectangle heights.
- just
Justification of rectangle relative to its (x, y) location. If there are two values, the first value specifies horizontal justification and the second value specifies vertical justification. Possible string values are:
"left","right","centre","center","bottom", and"top". Default value isjust = "center".- default.units
A string indicating the default units to use if
x,y,width, andheightare only given as numerics or numeric vectors. Default value isdefault.units = "inches".- linecolor
A character value specifying rectangle line color. Default value is
linecolor = "black".- lwd
A numeric specifying rectangle line width. Default value is
lwd = 1.- lty
A numeric specifying rectangle line type. Default value is
lty = 1.- fill
A character value specifying rectangle fill color. Default value is
fill = NA.- alpha
Numeric value specifying color transparency. Default value is
alpha = 1.- params
An optional pgParams object containing relevant function parameters.
- ...
Additional grid graphical parameters. See gpar.
Value
Returns a rect object containing
relevant placement and grob information.
See also
Examples
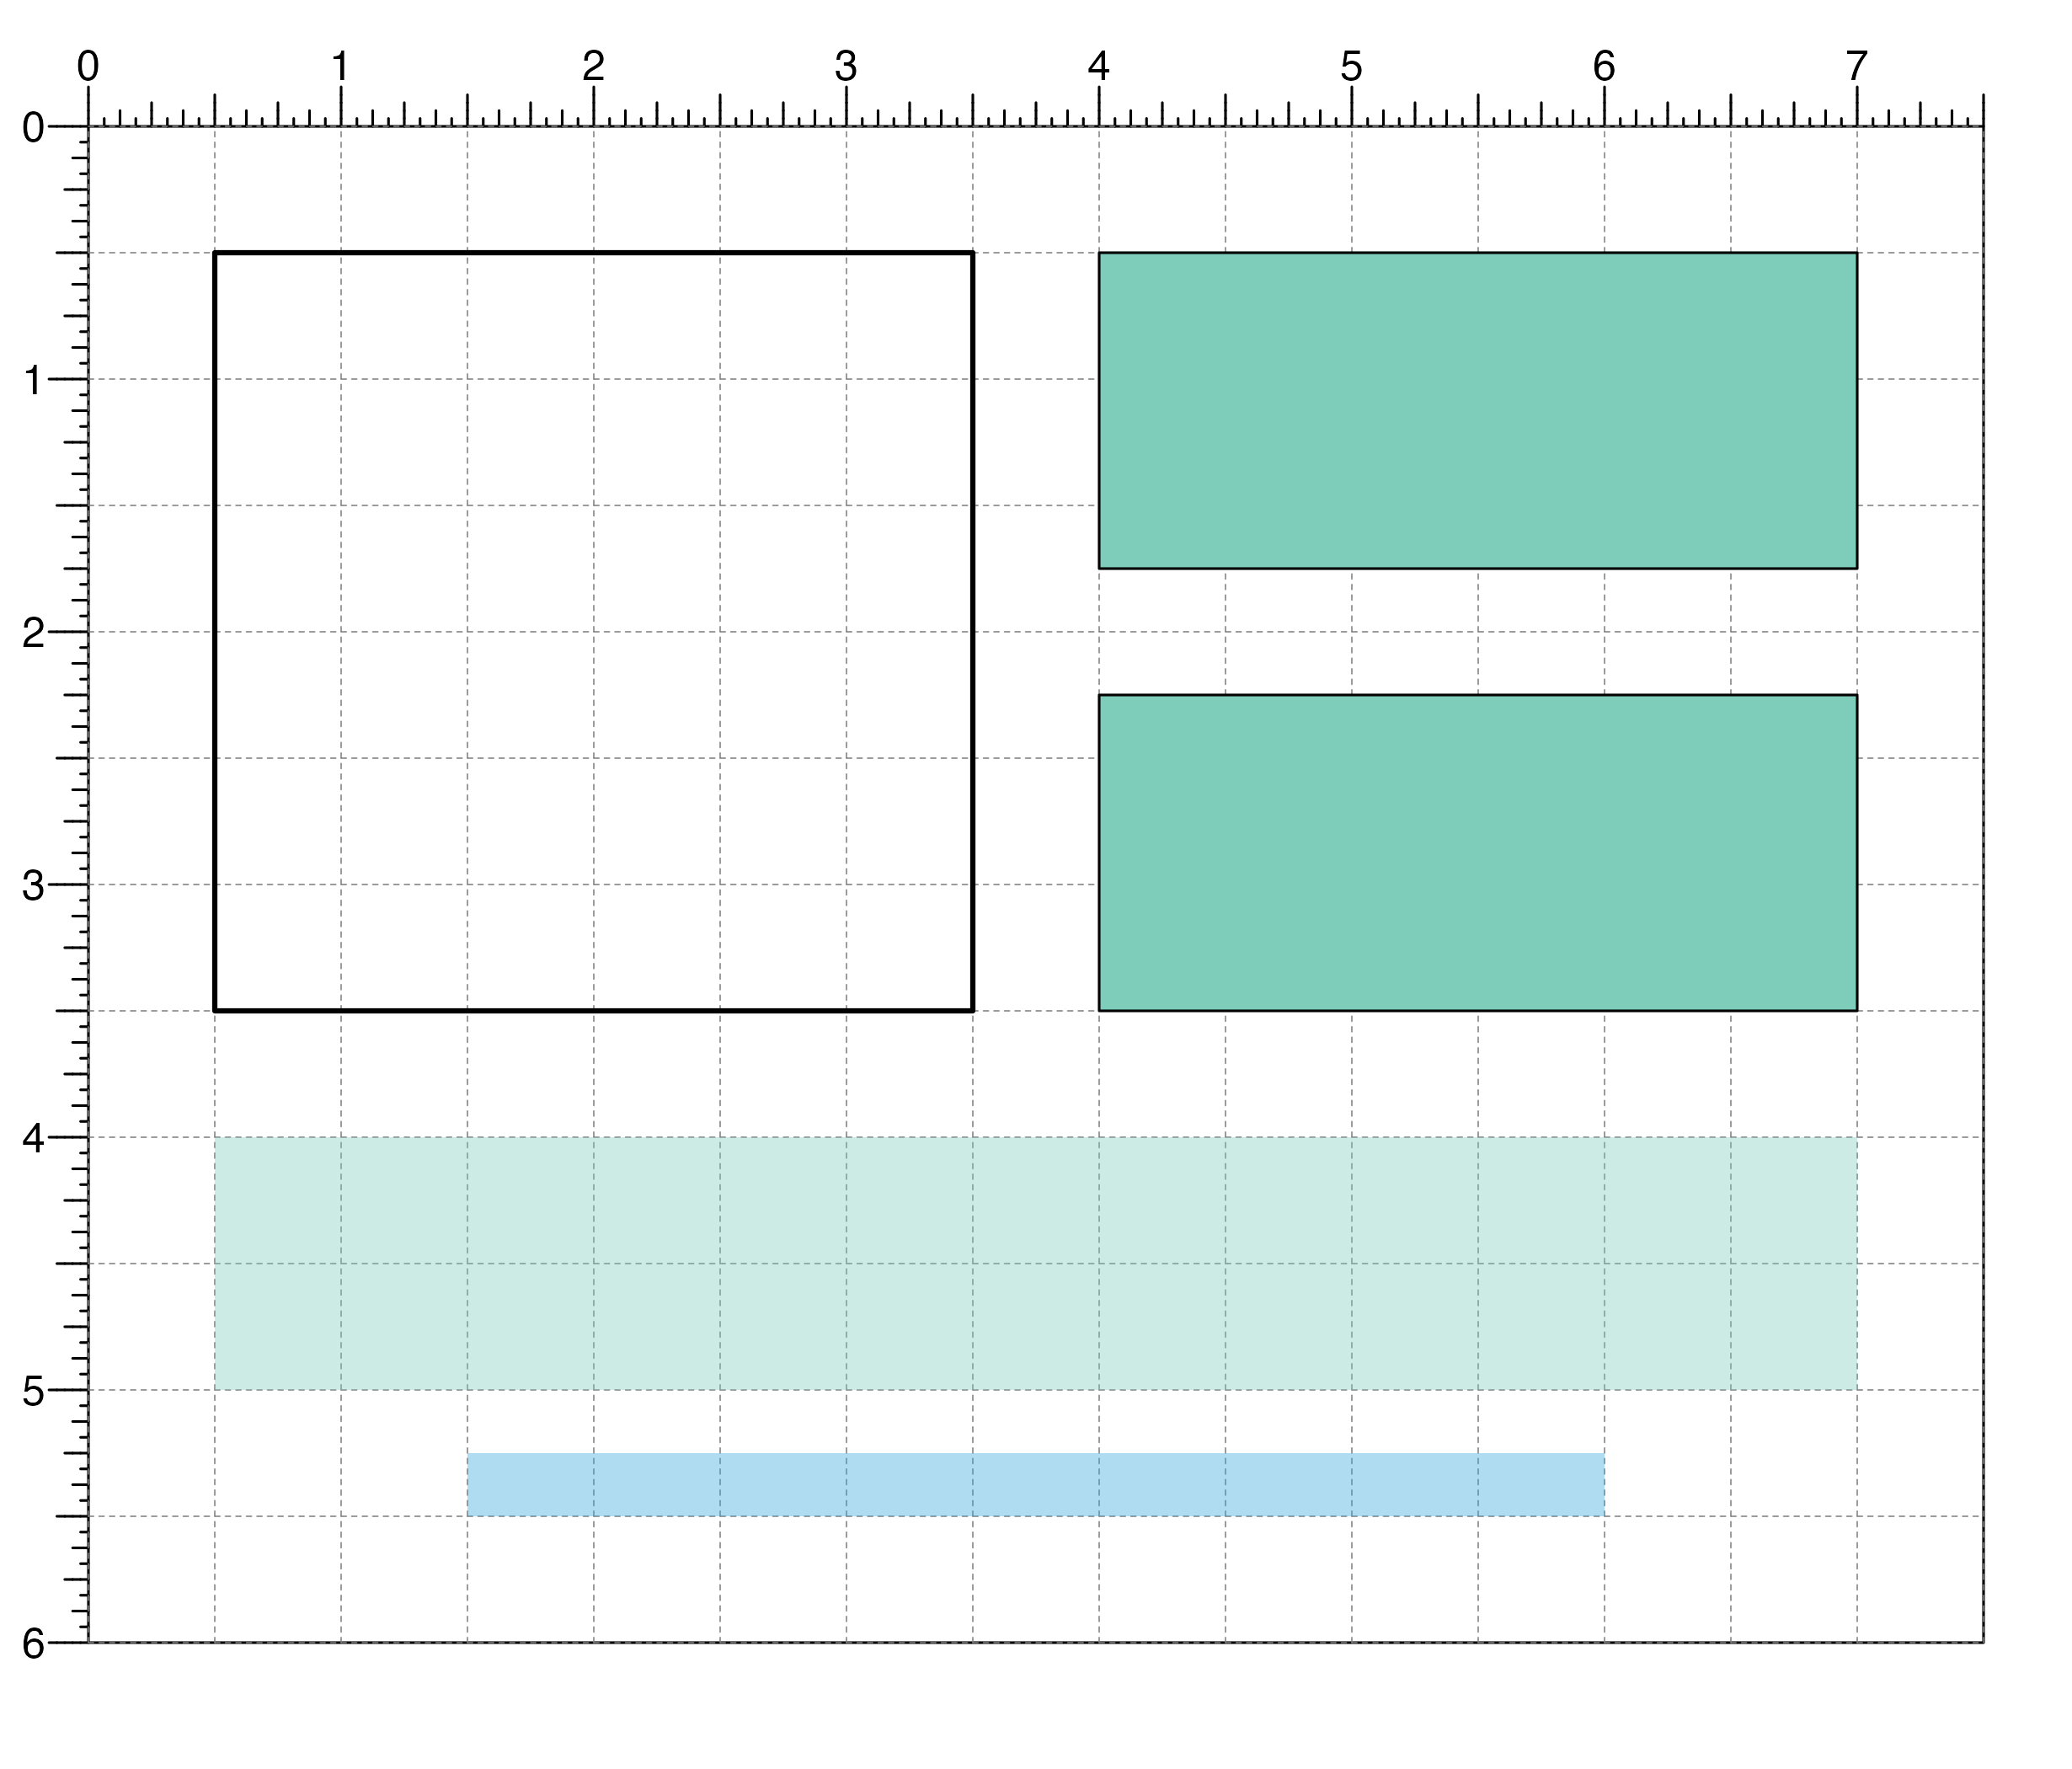
## Create a page
pageCreate(width = 7.5, height = 6, default.units = "inches")

## Plot one rectangle with no fill
plotRect(
    x = 0.5, y = 0.5, width = 3, height = 3,
    just = c("left", "top"), default.units = "inches",
    lwd = 2, fill = NA
)
#> rect[rect1]


## Plot two rectangles with same width and height at different locations
plotRect(
    x = 4, y = c(0.5, 2.25), width = 3, height = 1.25,
    just = c("left", "top"), default.units = "inches",
    fill = "#7ecdbb"
)
#> rect[rect2]

## Plot two rectangles with different widths, heights,
## locations, and colors
plotRect(
    x = 3.75, y = c(4, 5.25), width = c(6.5, 4.5),
    height = c(1, 0.25),
    just = "top", default.units = "inches",
    fill = c("#7ecdbb", "#37a7db"), linecolor = NA, alpha = 0.4
)

#> rect[rect2]

## Hide page guides
pageGuideHide()
#> rect[rect2]
## Hide page guides
pageGuideHide()